

- Custom Variable Widget
- Priority Matrix
- Heatmap Widget
- Grid Widget
- Weighted mean widget
- Comment List widget
- Widget Filters
- Ranking List Widget
- Distribution Chart
- NPS Widget
- Trend Widget
- Word Cloud Widget
- Cross tab widget
- KPI Comparison Widget
- Bubble chart
- Custom Metric Trend Chart
- Trend Comparison Widget

Bar Chart Widget
The Bar Chart widget lets you visualize Customer Experience survey data using bars. It can be used to compare response counts, averages, NPS, CSAT, and CES across questions, custom variables, or segments.
The Bar Chart supports both Single Survey and Segments data sources.
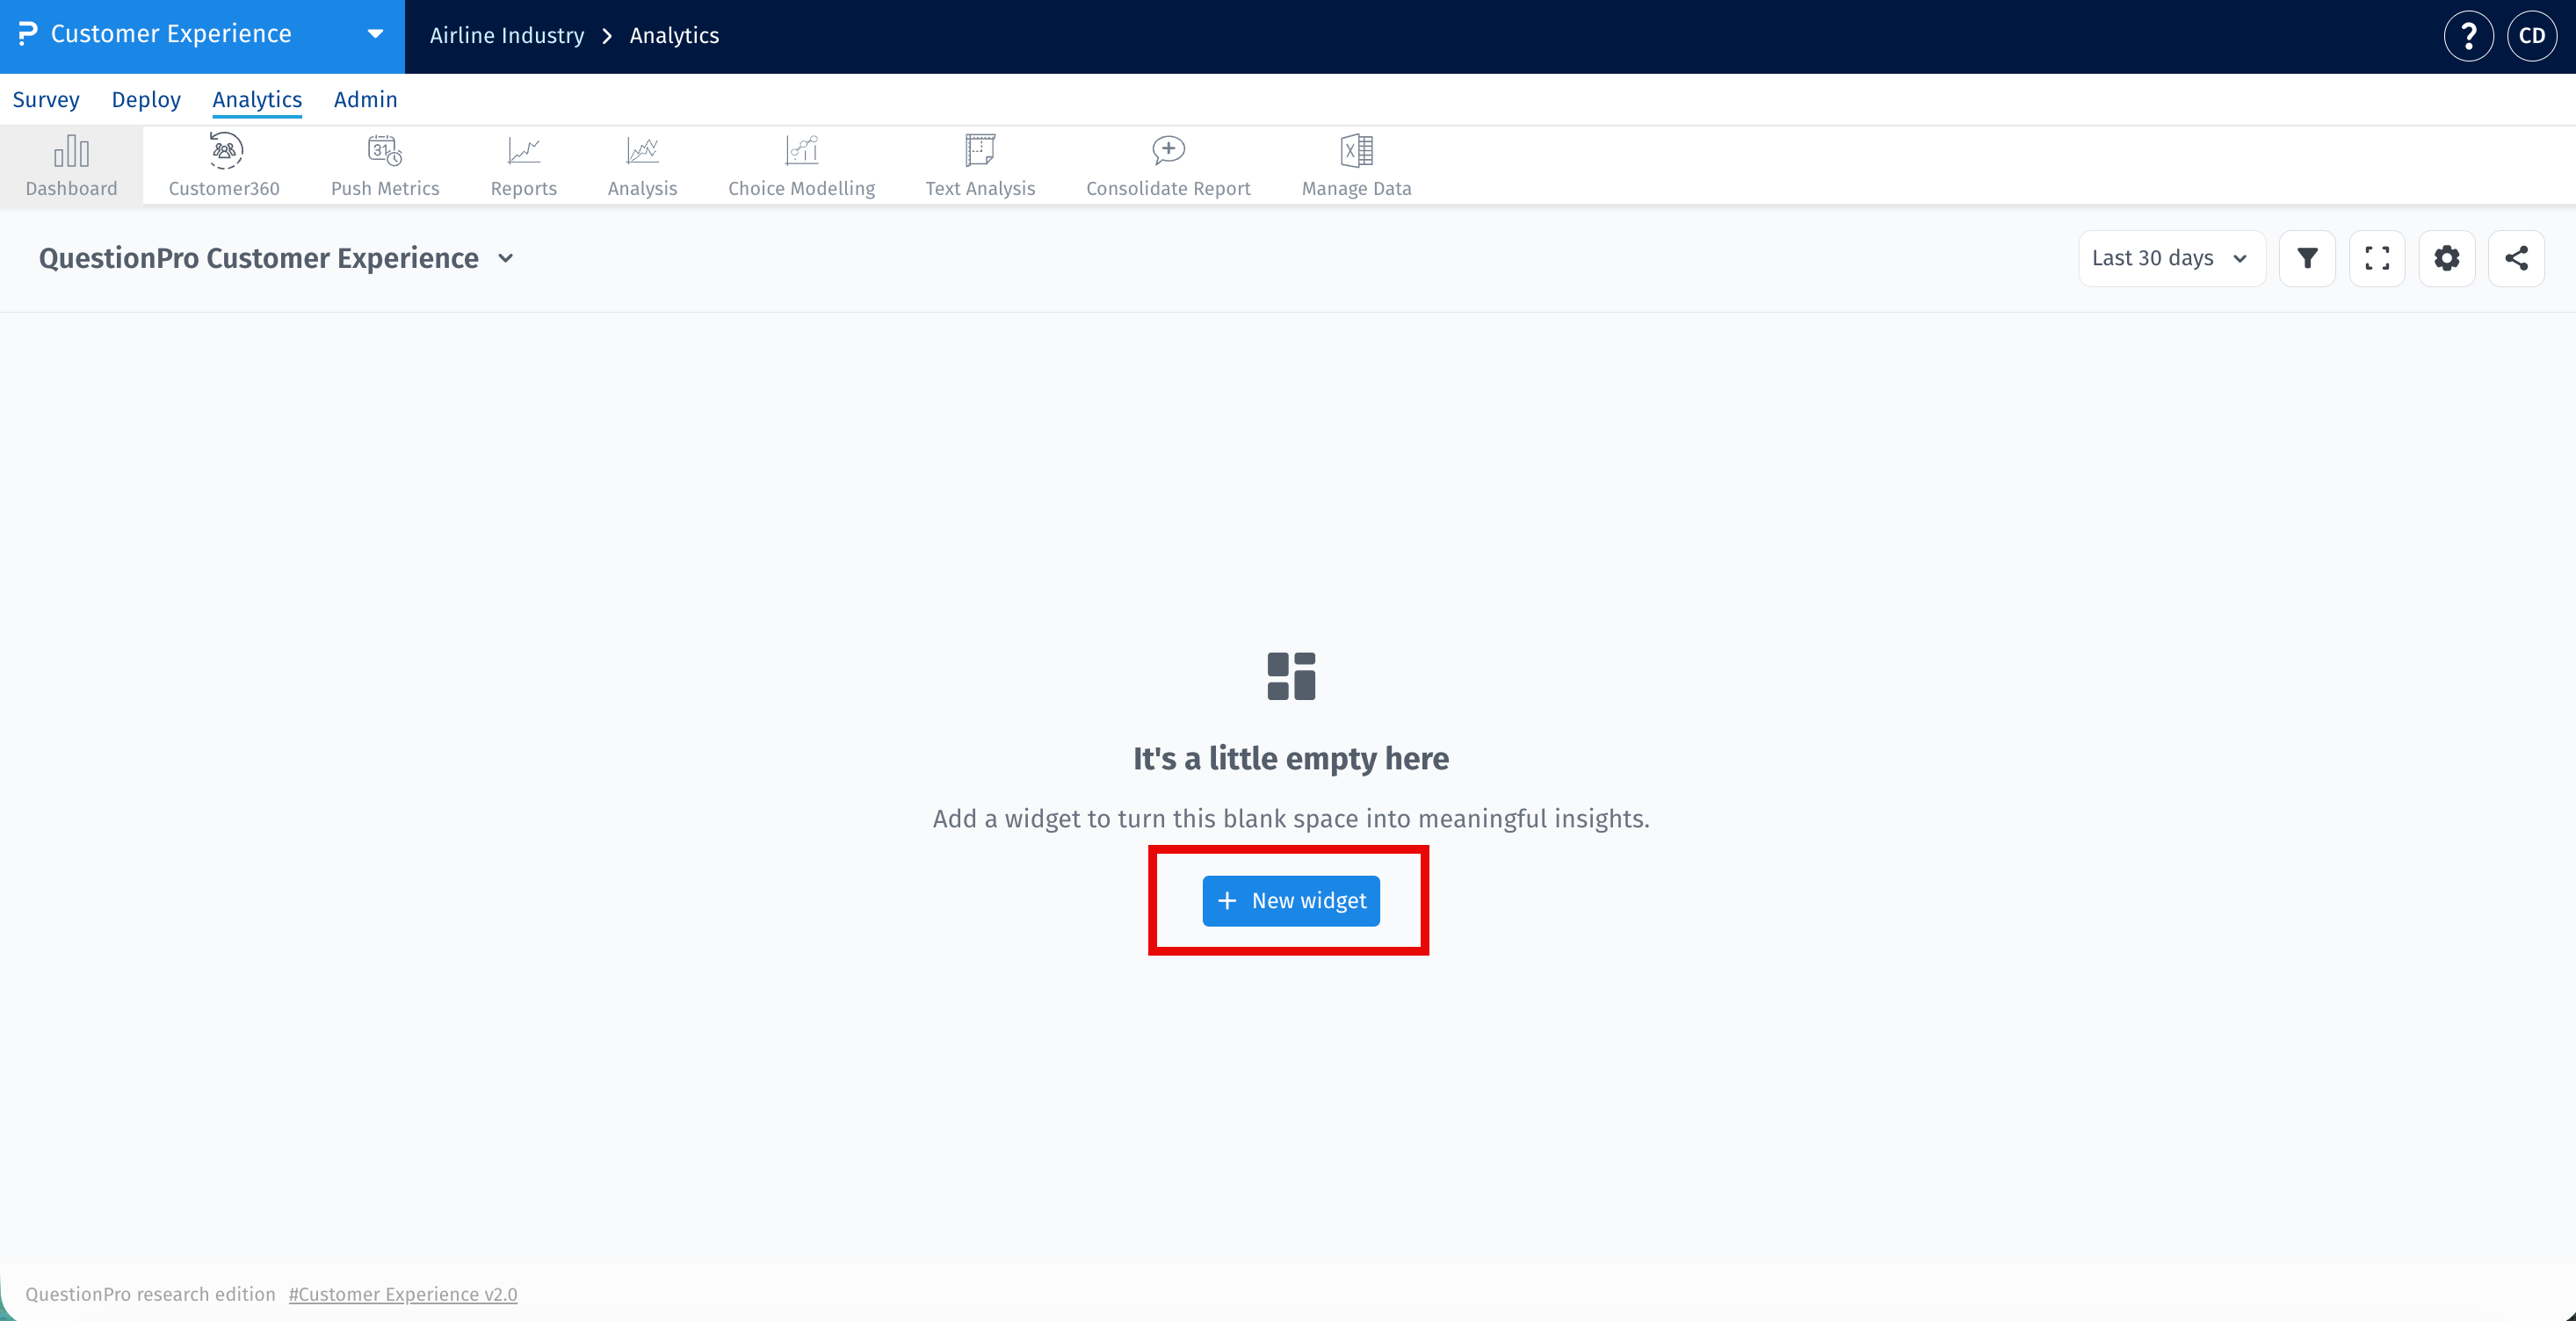
- Open the required CX Dashboard.
-
Click Add Widget.

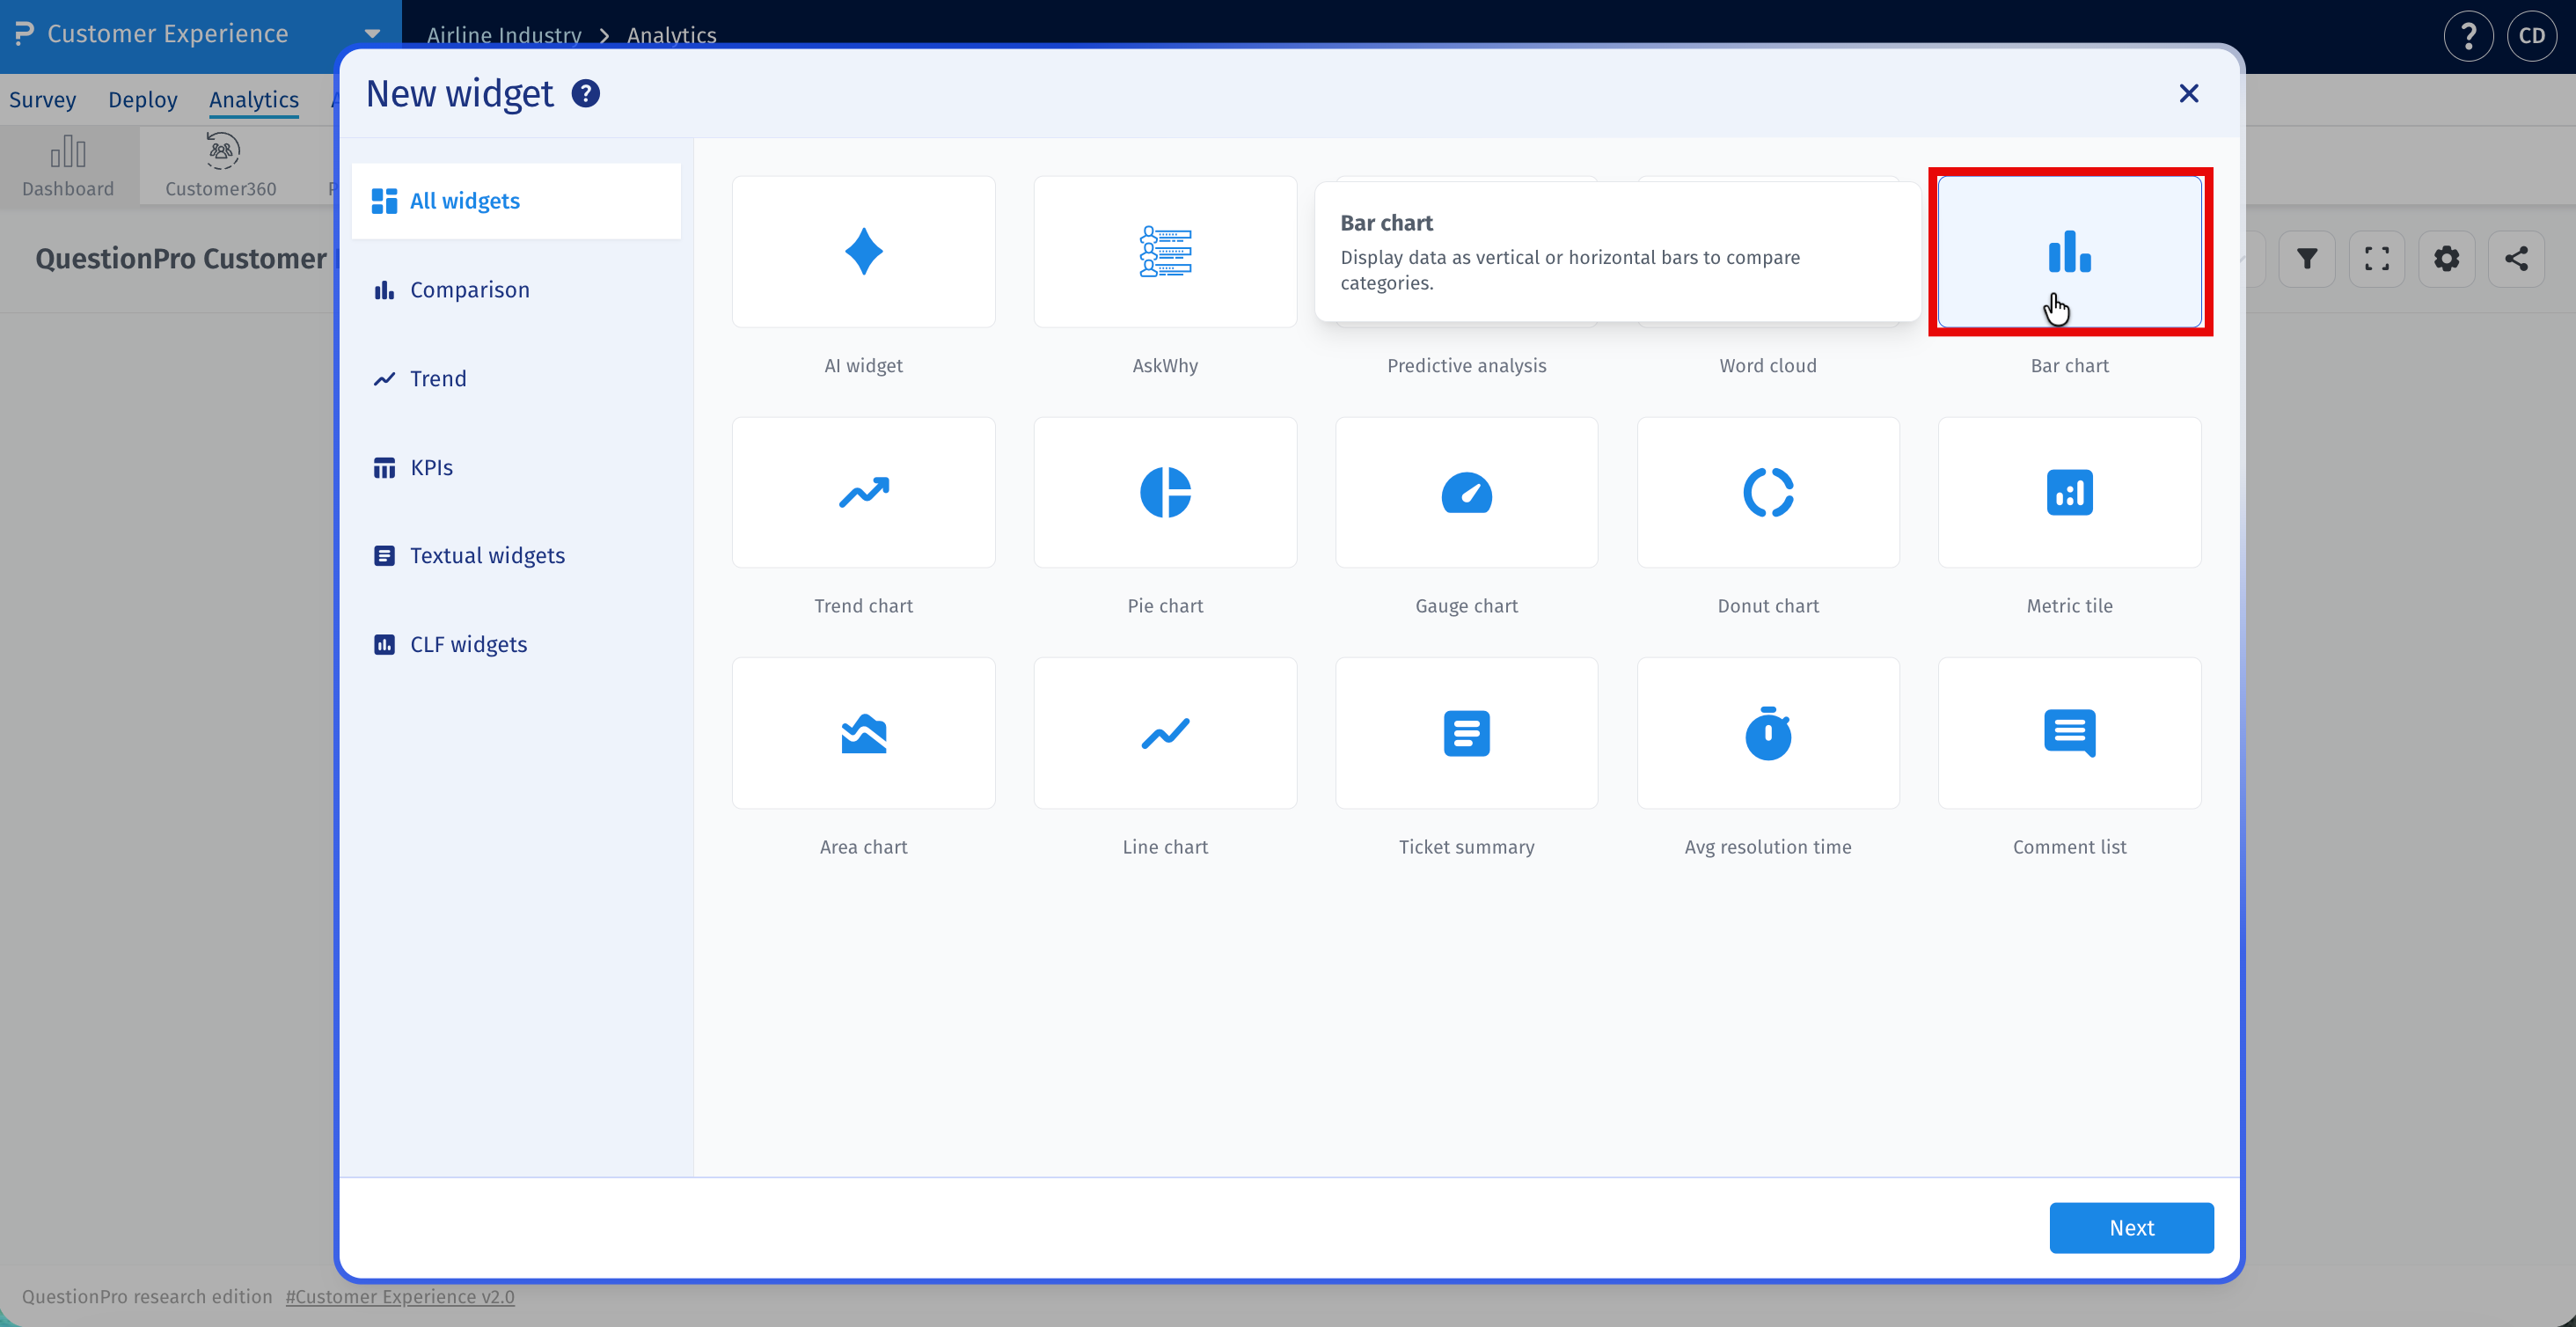
-
Select Bar Chart.
- Configure the required Source, X-axis, and Y-axis.
- Apply filters if required.
- Configure the widget display settings.
- Click Add Widget.
The Bar Chart supports two data sources:
- Single Survey - Select one survey and visualize data from its questions, custom variables, or segments.
- Segments - Select one or more segments and compare their CX metrics.
The available configuration options depend on the selected data source.
When Single Survey is selected as the source, configure the Bar Chart using the following fields:
Source
Select one survey. The selected survey determines the questions, custom variables, and segments available for the widget.
X-axis
The X-axis determines the categories displayed as bars. You can select:
- Question - Select a question and then select its answer options.
- Custom variable - Select a custom variable from Variable 1-100 and then select its values.
- Segments - Select one or more segments to compare.
When Question is selected, all answer options are selected by default. At least one answer must be selected.
When Custom variable is selected, up to 50 values can be selected. All available values are selected by default.
When Segments is selected as the data source, the Bar Chart compares one or more segments.
The selected segments are automatically used as the X-axis.
You can select one or more segments. There is no upper limit on the number of segments that can be selected.
The available metrics are:
- Count
- NPS
- CSAT
- CES
The Average metric is not available when Segments is selected as the data source.
The available metrics depend on the selected data source.
Single Survey
- Count
- Average
- NPS
- CSAT
- CES
Segments
- Count
- NPS
- CSAT
- CES
The default metric is Count.
A metric question is required for every metric except Count.
- Average - Any question in the survey can be selected.
- NPS - Select an NPS question or a question with a custom score of type NPS.
- CSAT - Select a CSAT question or a question with a custom score of type CSAT.
- CES - Select a CES question.
A metric question is not required for a Segments source.
The Mean CSAT option is available when CSAT is selected as the metric.
- Off - Displays CSAT as a percentage. This is the default.
- On - Displays the mean CSAT score on a 0-10 scale.
The Group by option is available for Single Survey sources.
When the X-axis is set to Question, you can group the results by a custom variable.
- Up to 30 custom-variable values can be displayed.
- The first 10 values are selected by default.
When the X-axis is set to Custom variable, you can group the results by a question.
- Up to 30 question answers can be displayed.
Group by is not available when the X-axis is set to Segments.
By default, the Bar Chart uses the dashboard date range.
Enable Use widget date filter to apply a separate date range to the widget.
The available date ranges are:
- Last 7 days
- Last 30 days
- Last 90 days
- Last 365 days
- Custom date range
The default widget date range is Last 30 days.
The widget date range can only narrow the dashboard date range. If the dashboard and widget date ranges do not overlap, the widget displays no data.
Open the Filters tab to apply additional conditions to the widget.
For a Single Survey source, the available filters are:
- Segment
- Question
- Custom variable
The first filter row defaults to Question.
For a Segments source, the available filters are:
- Survey
- Custom variable
The first filter row defaults to Survey.
You can add up to 10 widget-level filter conditions. All widget filters are combined using AND logic.
Dashboard-level filters always apply to the Bar Chart. Widget-level filters can only narrow the data further and cannot expand the dashboard filter selection.
Dashboard filters include:
- Date range
- Up to 50 segments
- Up to 50 custom-variable values
- Question filters
- Response status
Dashboard and widget filters are combined using AND logic.
The available response statuses are Completed, Started, and Terminated. If no response status is selected, all statuses are included.
Open the Settings tab to customize the chart appearance.
The following settings are available:
- Show tooltip on hover - On or Off. Default is On.
- Show legend - On or Off. Default is On.
- Show axis lines - On or Off. Default is On.
- Show chart labels - On or Off. Default is Off.
- Grid lines - Off, Solid, or Dotted. Default is Off.
- Axis labels - Off or custom X-axis and Y-axis text. Each label can contain up to 50 characters.
- Custom theme - Use the dashboard theme or select a custom theme. Default is Off.
- Benchmarks - Add up to three fixed benchmark lines.
- Sort by bar value - Off, Ascending, or Descending. Default is Off.
You can add up to 3 fixed benchmark lines to the Bar Chart.
Each benchmark can be configured with:
- Name
- Value
- Colour
- Line style
The available line styles are:
- Solid
- Dashed
- Dotted
What metrics are available in the Bar Chart?
Single Survey sources support Count, Average, NPS, CSAT, and CES. Segments sources support Count, NPS, CSAT, and CES.
Can I use Average with a Segments source?
No. Average is available only when the data source is a Single Survey.
How many widget filters can I add?
You can add up to 10 widget-level filter conditions.
Can I filter the Bar Chart using custom variables?
Yes. Custom-variable filters are available for both Single Survey and Segments sources.
Can I compare multiple segments?
Yes. You can select multiple segments and compare their metrics using the Bar Chart.
Can I change the bar orientation?
Yes. You can display the bars vertically or horizontally.
Can I sort the bars?
Yes. You can sort bars in ascending or descending order based on their values.
Can I add benchmark lines?
Yes. You can add up to three fixed benchmark lines.
Do dashboard filters apply to the Bar Chart?
Yes. Dashboard filters always apply to the widget. Widget filters can only narrow the resulting data.
- Use Count when comparing response volume across categories.
- Use NPS, CSAT, or CES when comparing customer experience performance across groups.
- Use the Horizontal orientation when comparing a large number of categories.
- Use Sort by bar value to make rankings easier to identify.
- Use Benchmarks to compare performance against business targets.
- Use dashboard and widget filters together to create focused views of your CX data.
- Keep the number of categories manageable to make comparisons easier to interpret.
