

- Custom Variable Widget
- Priority Matrix
- Heatmap Widget
- Grid Widget
- Weighted mean widget
- Comment List widget
- Widget Filters
- Ranking List Widget
- Distribution Chart
- NPS Widget
- Trend Widget
- Word Cloud Widget
- Cross tab widget
- KPI Comparison Widget
- Bubble chart
- Custom Metric Trend Chart
- Trend Comparison Widget

CX Dashboard Overview
Introduction
CX Dashboard provides a centralized workspace for visualizing and analyzing survey and customer experience data. It allows you to monitor KPIs, identify trends, compare customer segments, and make data-driven decisions using interactive visualizations.
Dashboards are built using widgets such as charts, KPI tiles, gauges, tables, and text analytics. Each widget can be configured independently while working seamlessly with dashboard-level filters and interactions.
Watch this video to learn how to create a CX Dashboard, add widgets, configure visualizations, apply filters, and share dashboards with your team.
How do I create a CX Dashboard?
- Navigate to the appropriate CX Workspace.
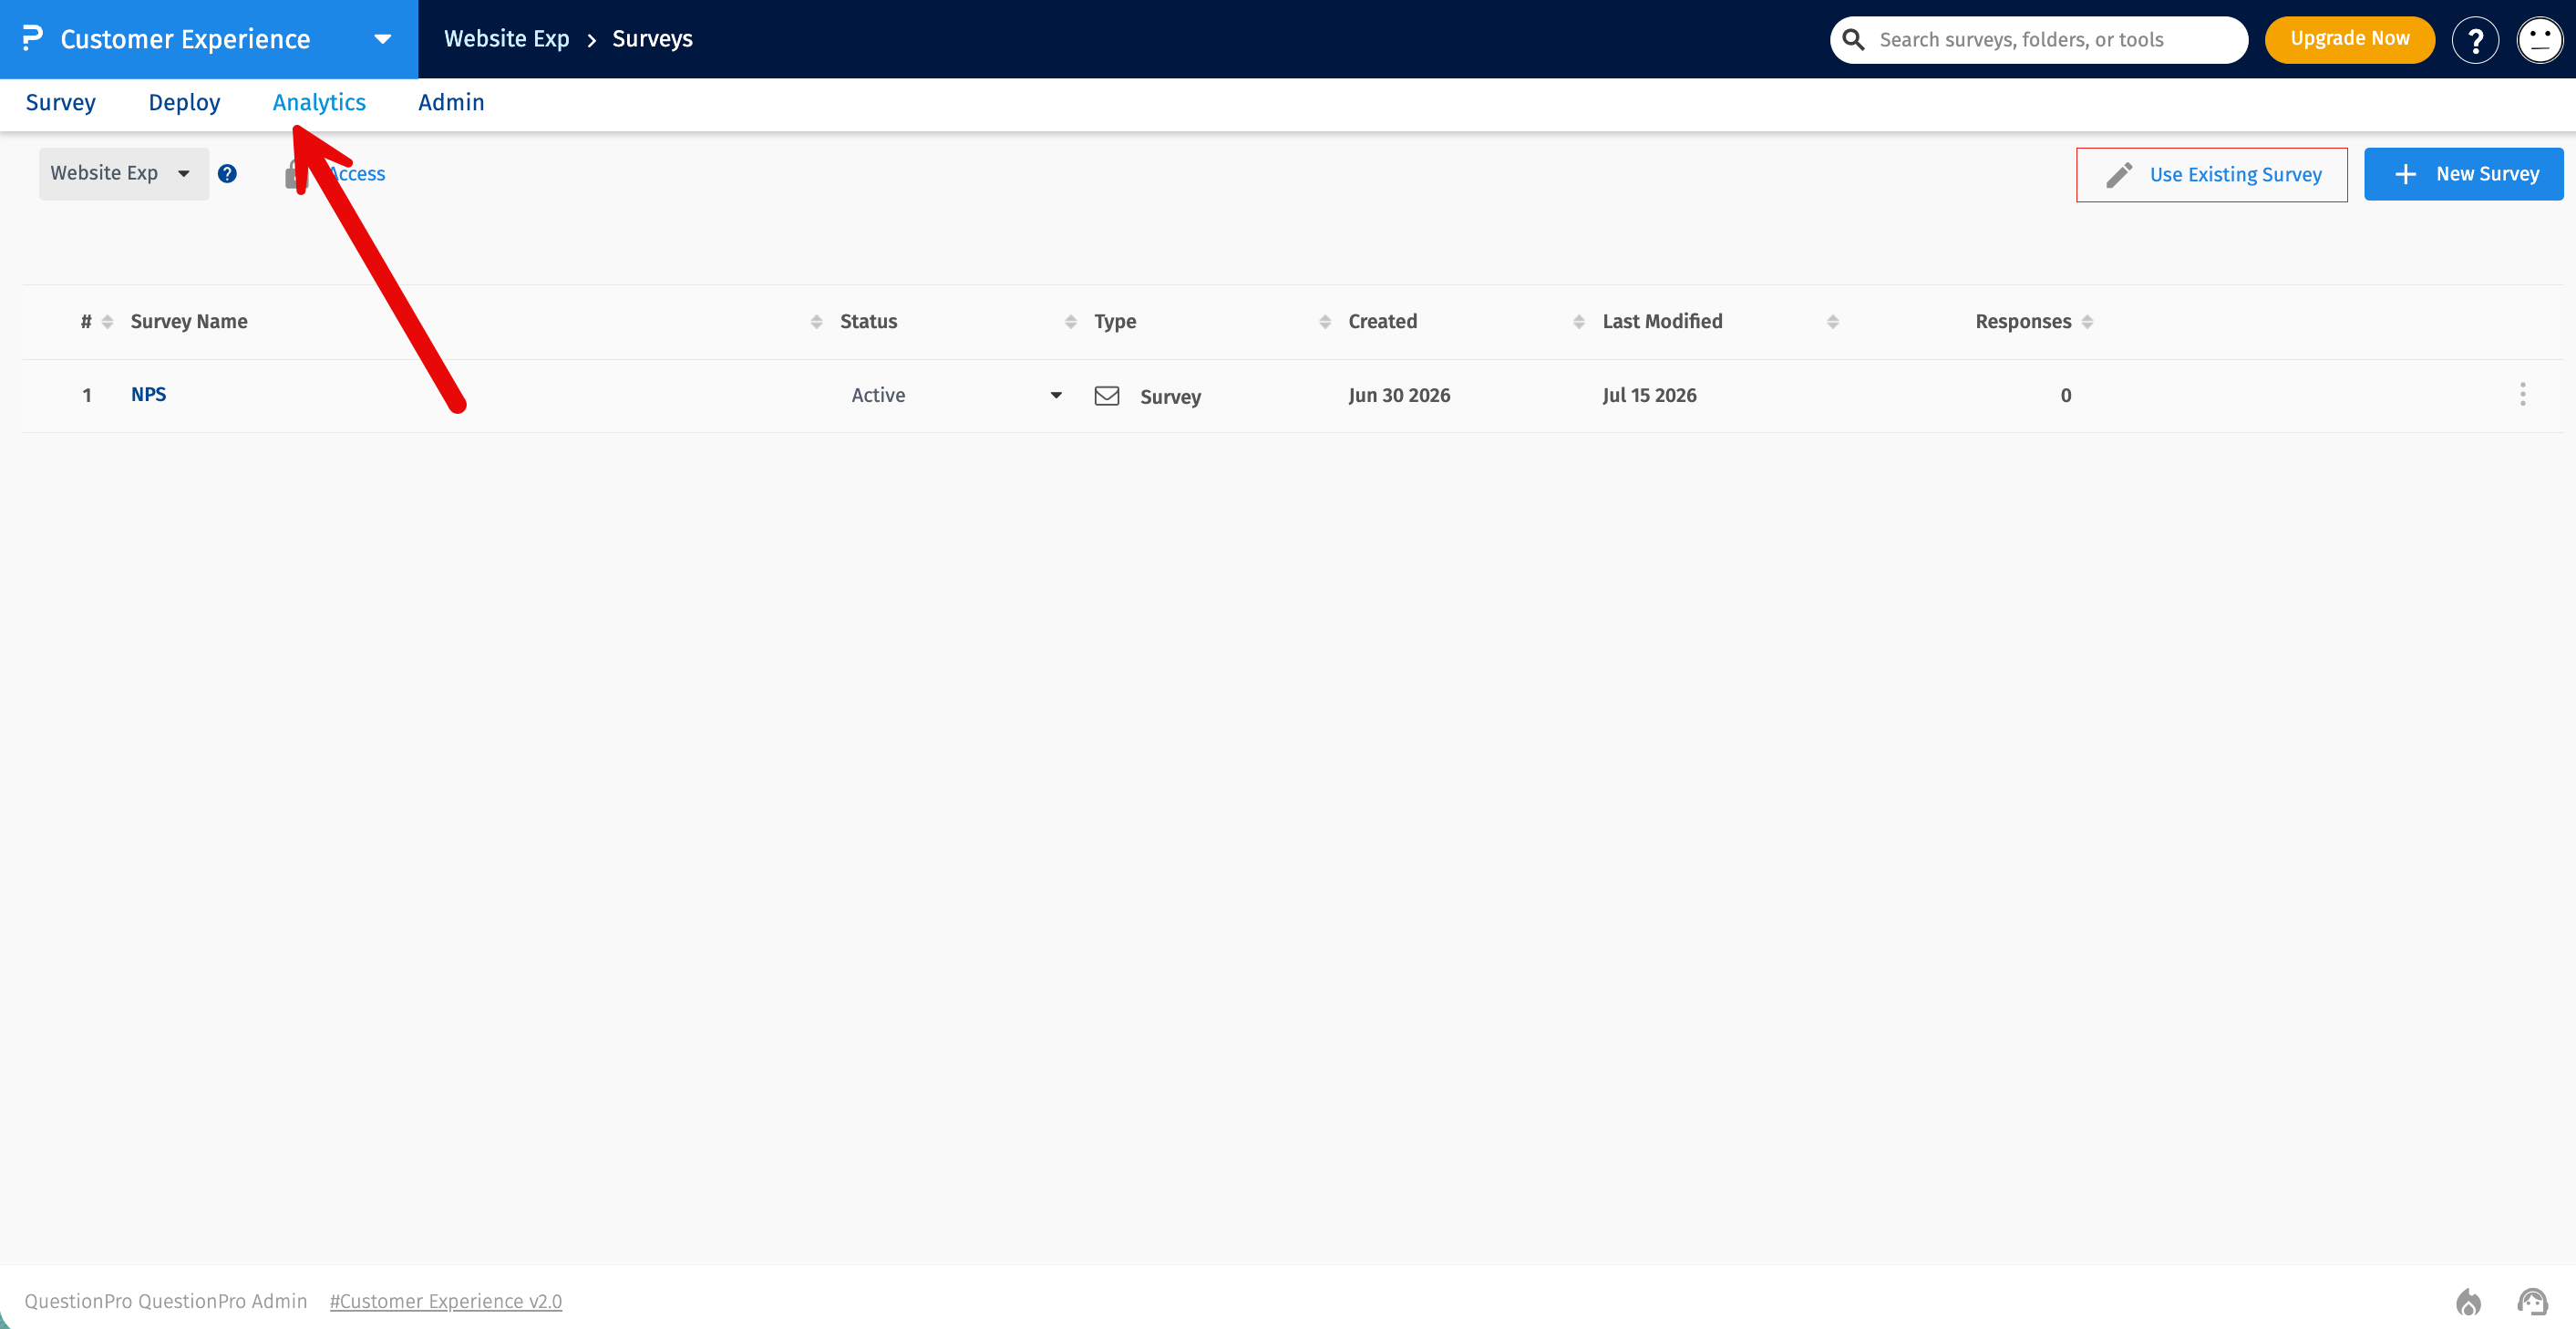
- From the menu, click Analytics.
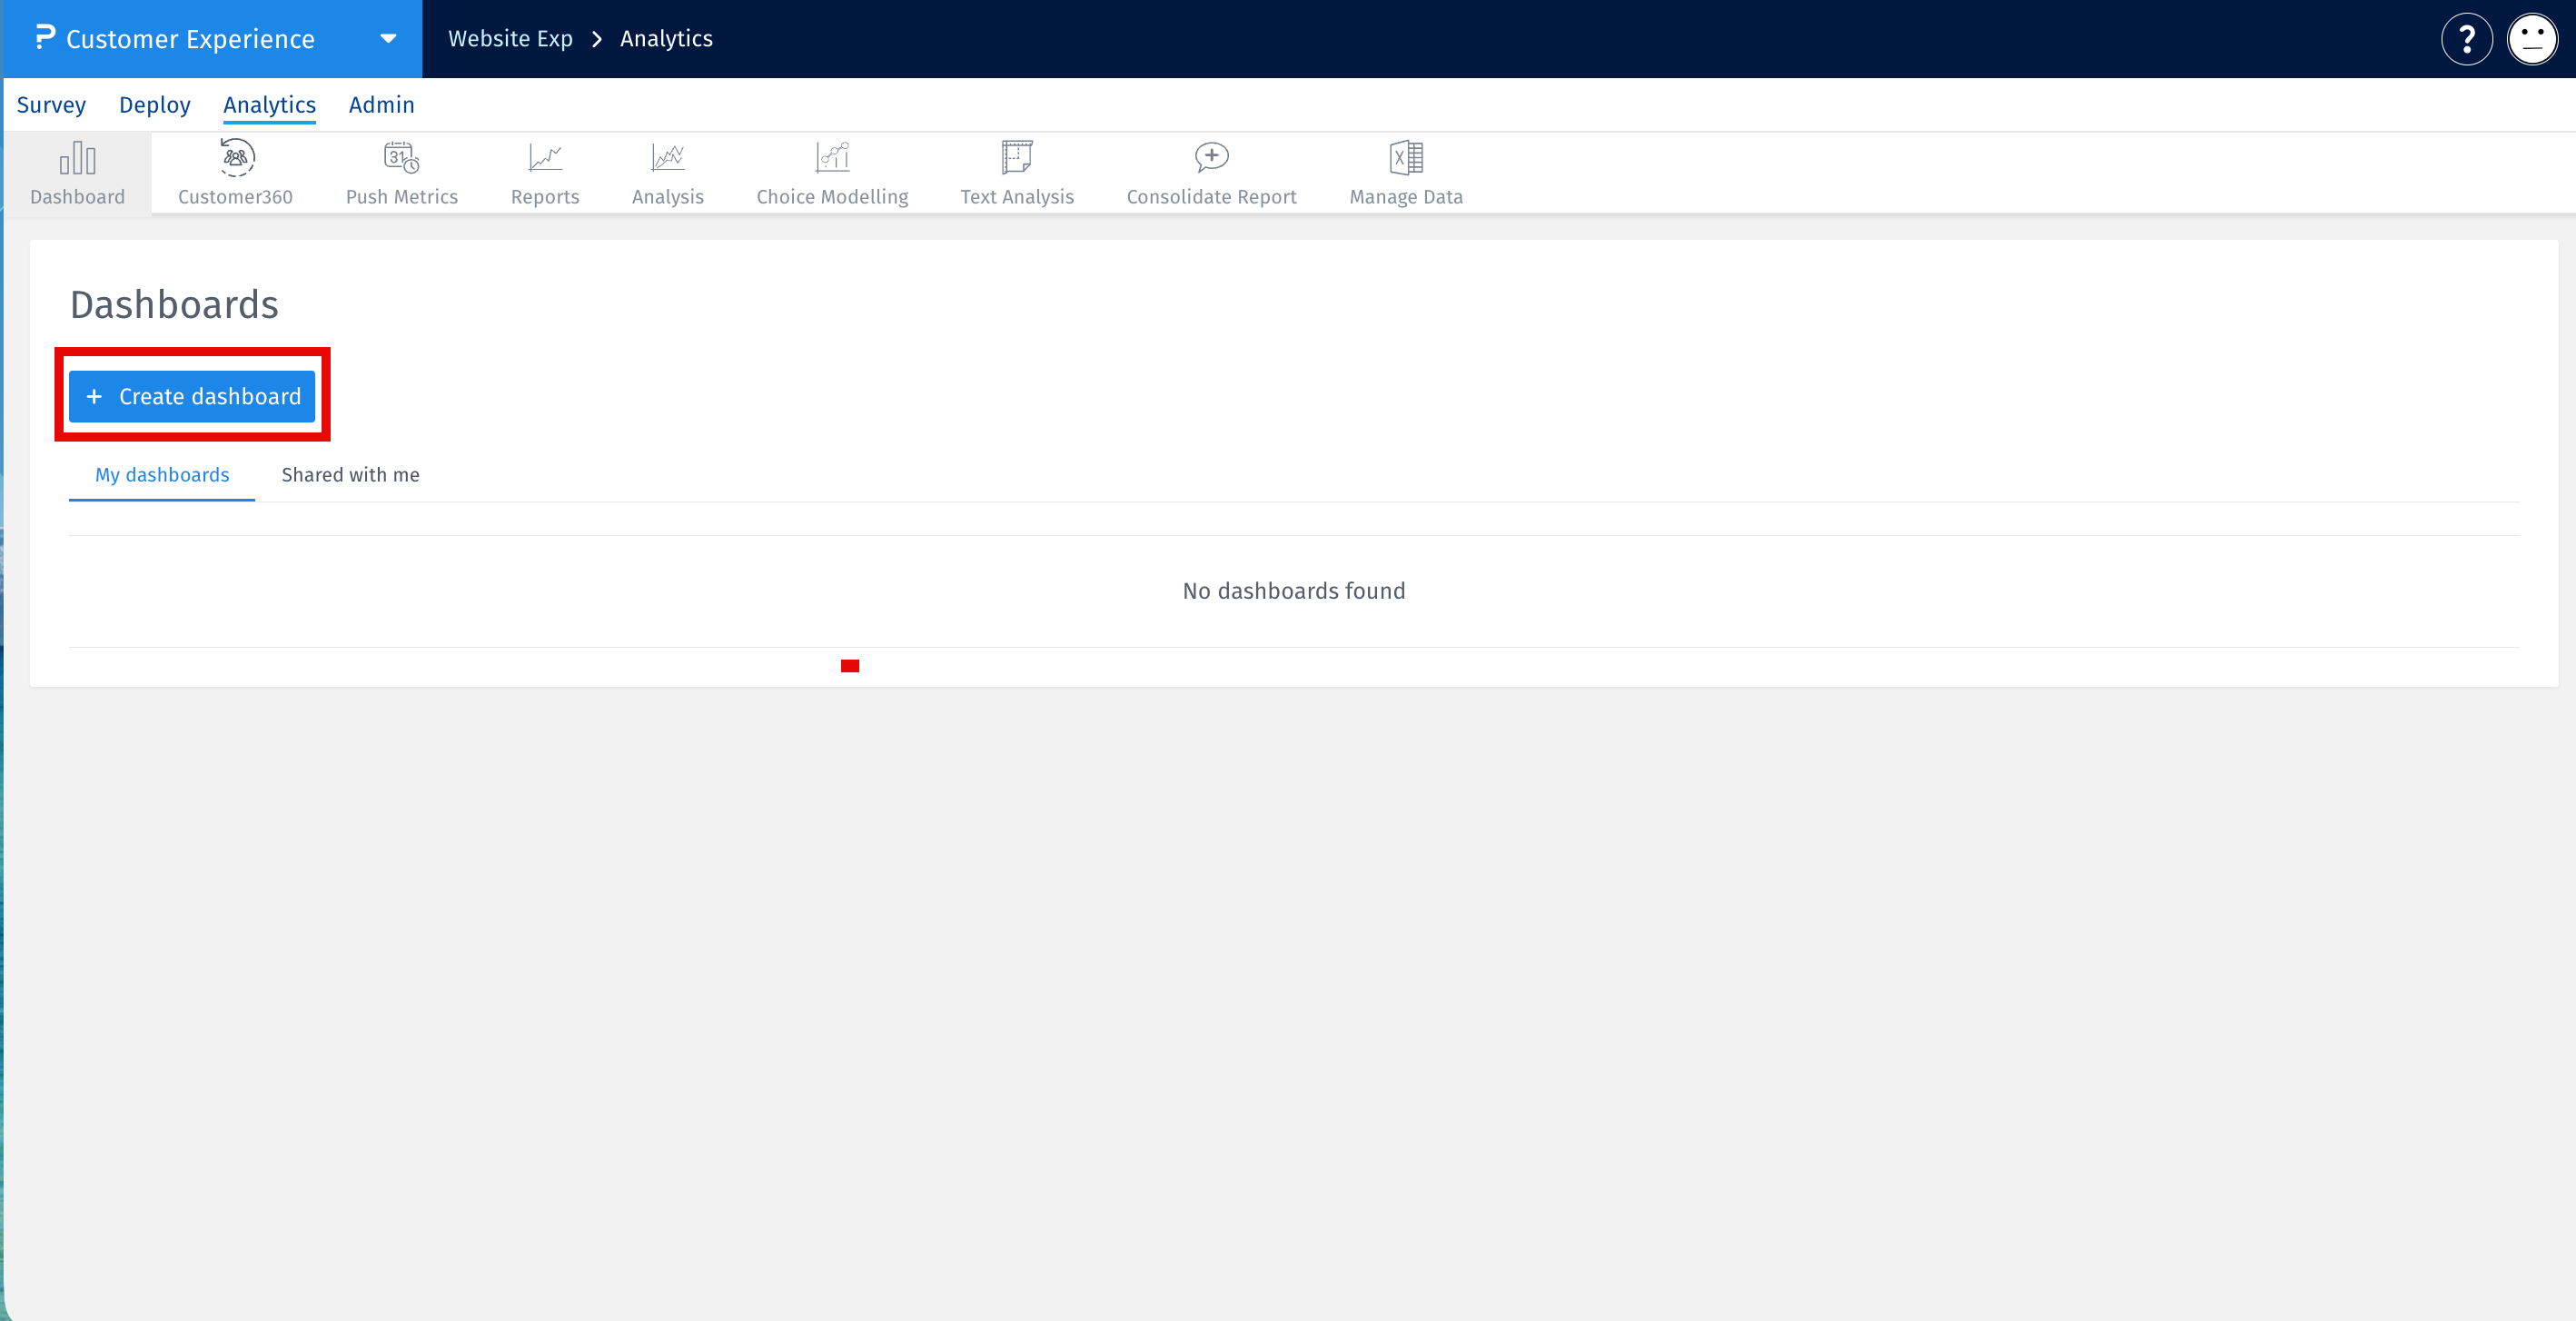
- Click the Create New Dashboard button.
- Enter a name for your dashboard and click Create.
-
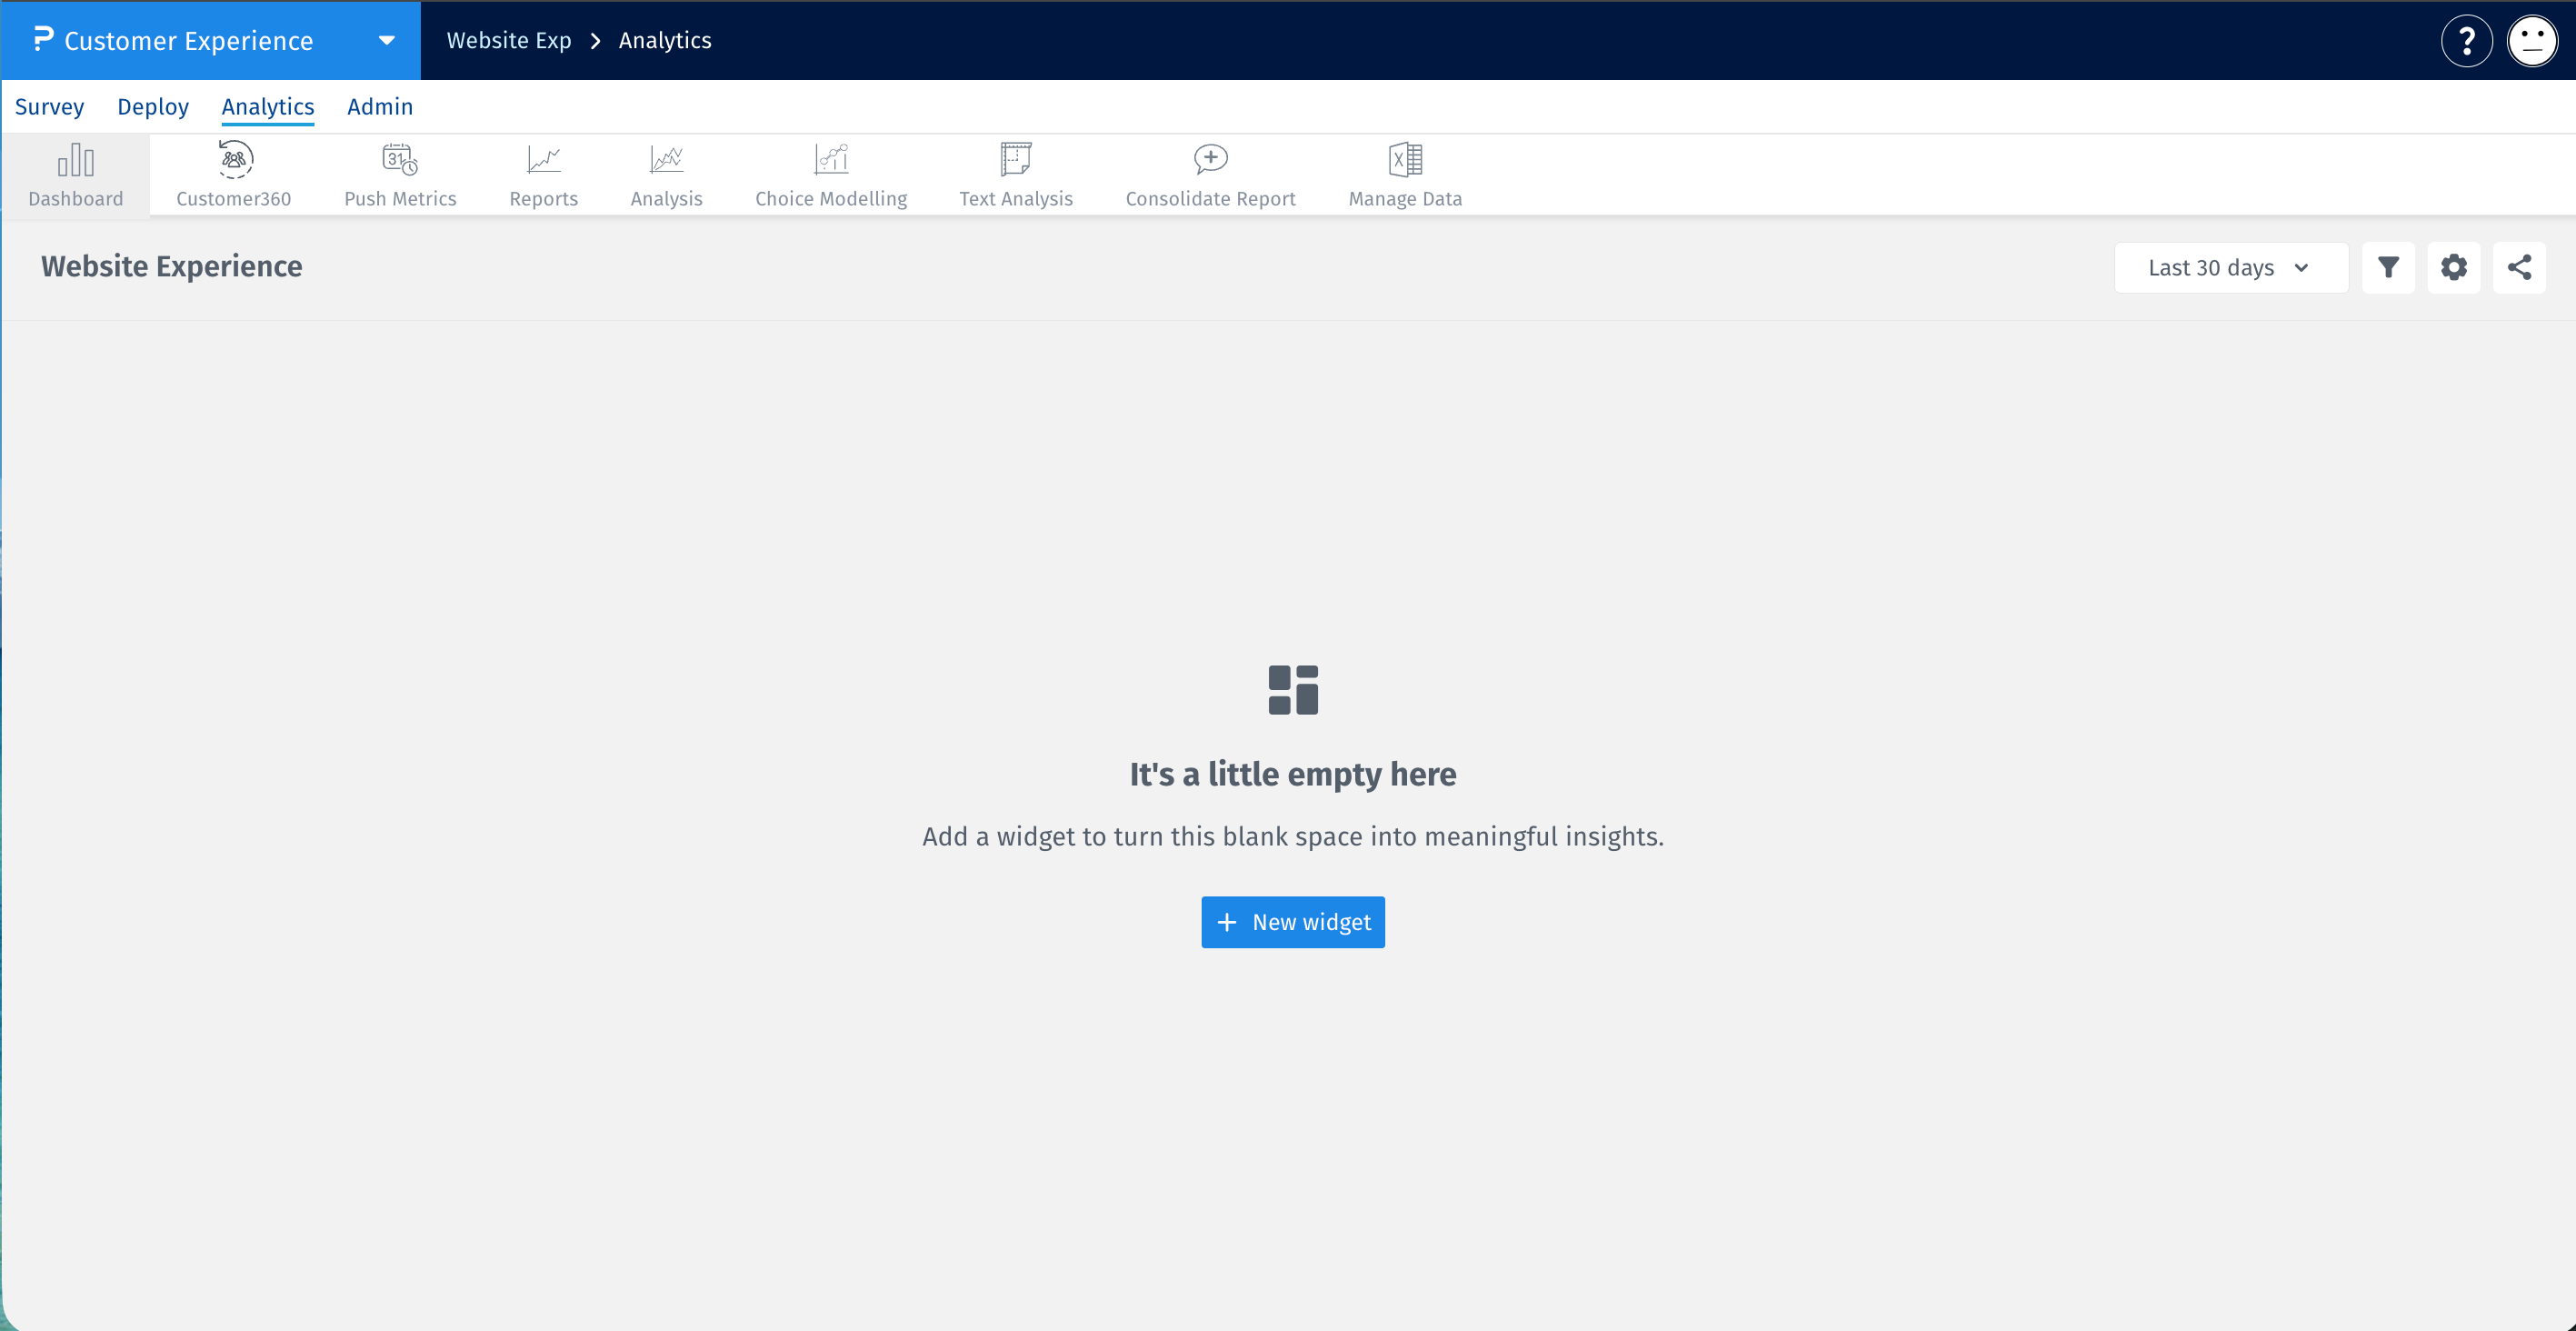
Click Add Widget to begin building your dashboard by adding charts, KPI tiles, gauges, tables, and other supported visualizations.

How do I add and configure widgets?
- Click Add Widget to open the widget library.
- Select the visualization that best represents your data. Available widgets include Metric Tile, Bar Chart, Line Chart, Area Chart, Pie Chart, Donut Chart, and Gauge Chart.
- Select a data source and configure the required metrics, dimensions, and filters for the selected visualization.
- Customize the widget using display settings such as the title, colors, legends, labels, sorting, and decimal precision.
- Click Save to add the widget to your dashboard.
How do dashboard filters work?
- Dashboard filters apply common filtering criteria across all widgets in the dashboard.
- Available global filters include Date Range, Segments, Questions, Products, and Custom Variables.
- Widgets inherit dashboard filters by default.
- Widget-level filters override dashboard filters whenever different filtering criteria are configured.
How do I organize my dashboard?
- Drag and drop widgets to rearrange them within the dashboard.
- Resize widgets to create a layout that best fits your analysis.
- Organize related widgets into multiple tabs for easier navigation.
- Duplicate an existing dashboard to reuse its layout and widget configuration.
Important considerations
- Every widget requires a valid data source before data can be displayed.
- Required metrics and dimensions must be configured before a widget can be saved.
- Invalid metric and dimension combinations are automatically disabled during widget configuration.
- Widget-level filters always take precedence over dashboard-level filters.
- Only dashboard owners can delete dashboards or transfer dashboard ownership.
- Save your dashboard regularly to ensure all changes are available to collaborators.
You may also be interested in...
