

- Custom Variable Widget
- Priority Matrix
- Heatmap Widget
- Grid Widget
- Weighted mean widget
- Comment List widget
- Widget Filters
- Ranking List Widget
- Distribution Chart
- NPS Widget
- Trend Widget
- Word Cloud Widget
- Cross tab widget
- KPI Comparison Widget
- Bubble chart
- Custom Metric Trend Chart
- Trend Comparison Widget

Cross Tab Widget
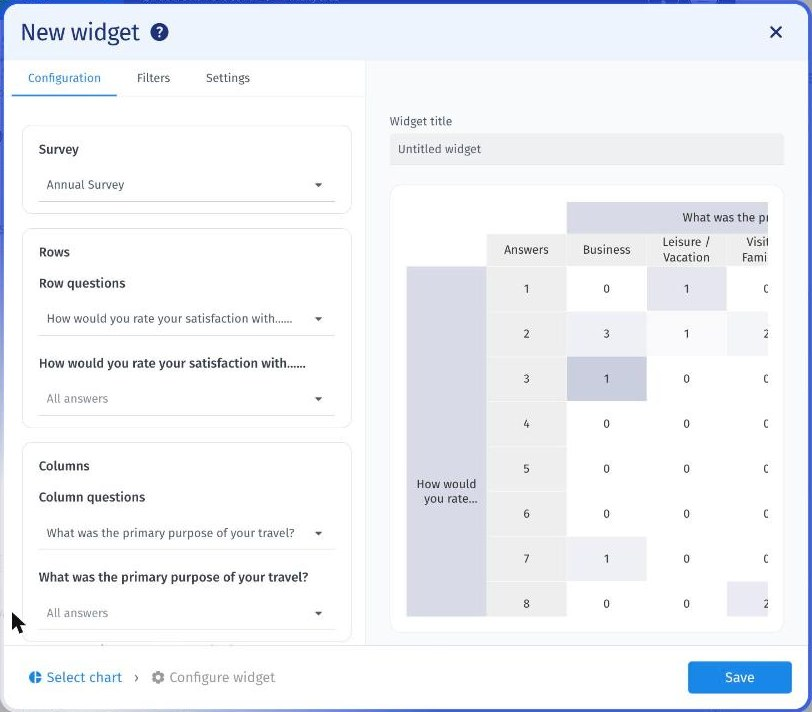
The Cross Tab widget compares the answers to two sets of survey questions in a single table. Row questions run down the side, column questions run across the top, and each cell shows how many respondents gave that pair of answers.
Use it to see how answers to one question differ across answers to another, such as satisfaction by purpose of travel. You can show counts, row percentages, column percentages and totals, and shade cells to make high values stand out.
-
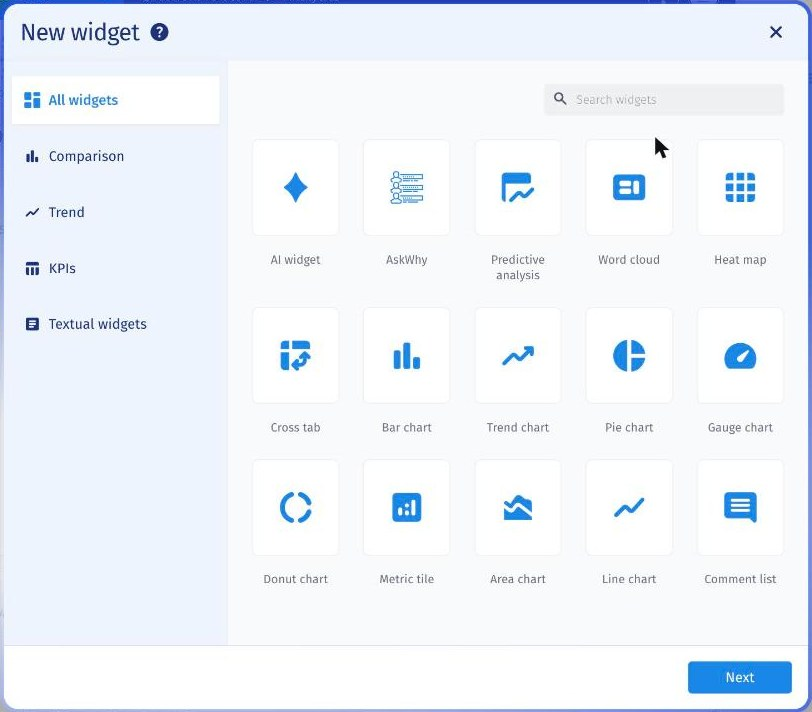
Go to Analytics > Dashboard, open your dashboard and click New widget. Select Cross tab. It is also listed under the Comparison category. The configuration screen opens as soon as you select it.

-
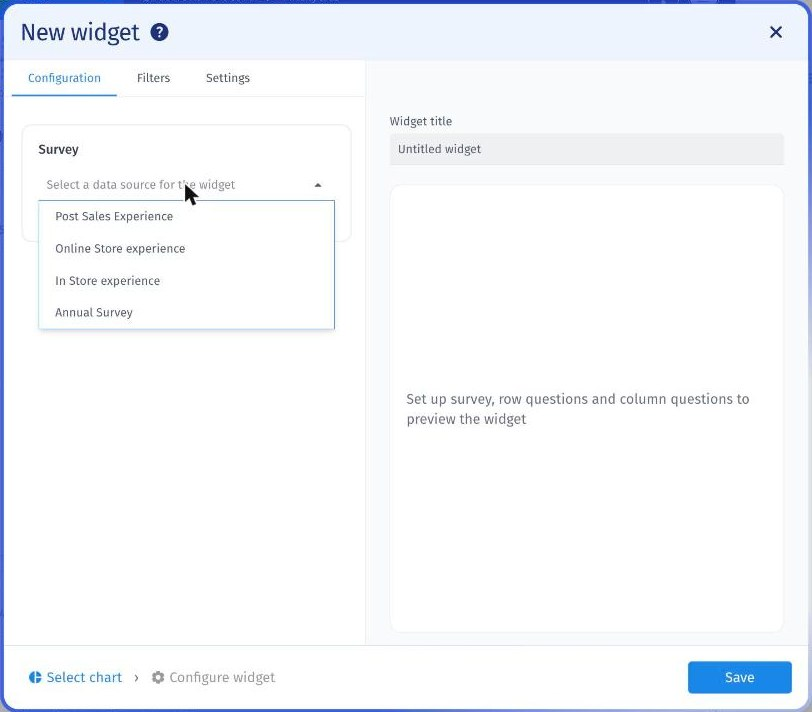
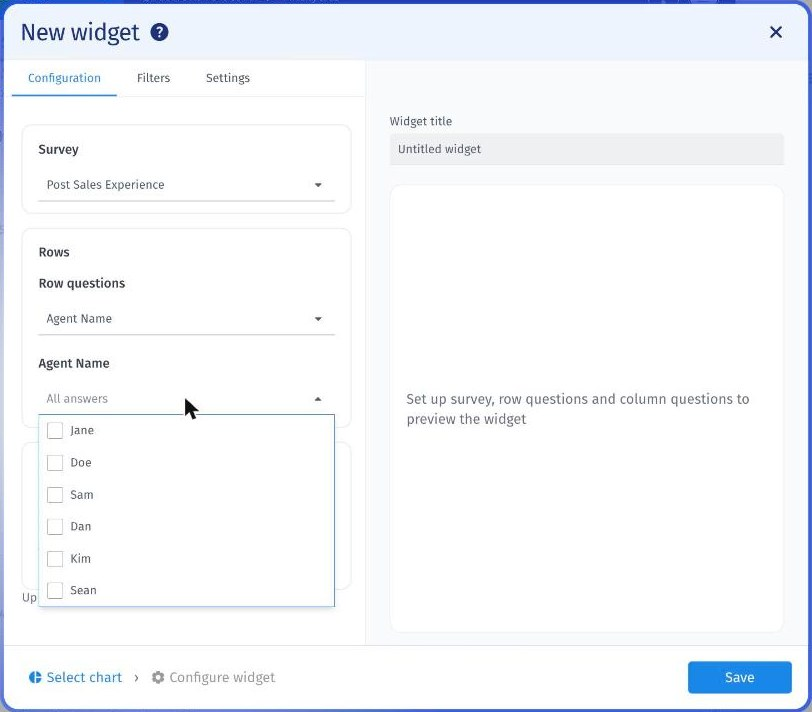
On the Configuration tab, choose one survey from the Survey dropdown. The Rows and Columns sections appear once a survey is selected.
-
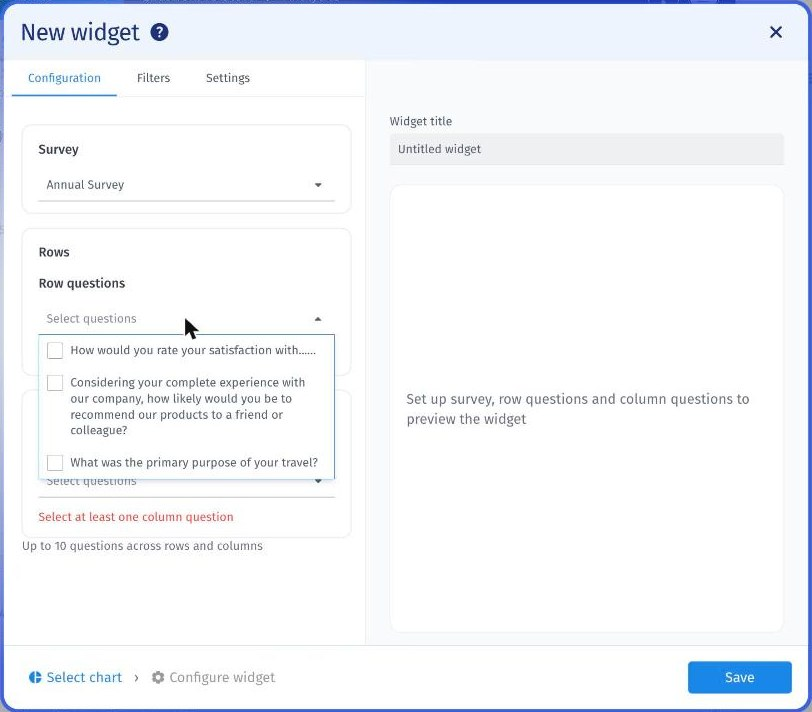
Under Rows, tick one or more questions in Row questions.
-
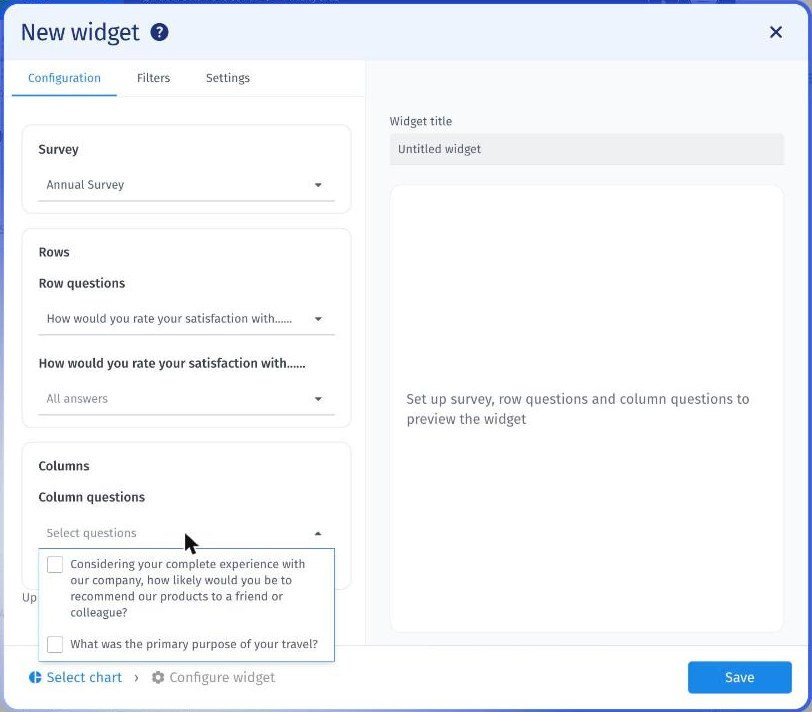
Under Columns, tick one or more questions in Column questions. A question used in Rows does not appear in this list.
-
Optional: Narrow the answers. Each selected question gets its own dropdown, set to All answers by default. Tick specific answers to limit the table to them.
-
Check the preview. The table appears on the right once a survey, a row question and a column question are set. Add a name in Widget title.
- Set any date range, filters and display options you need, then click Save.
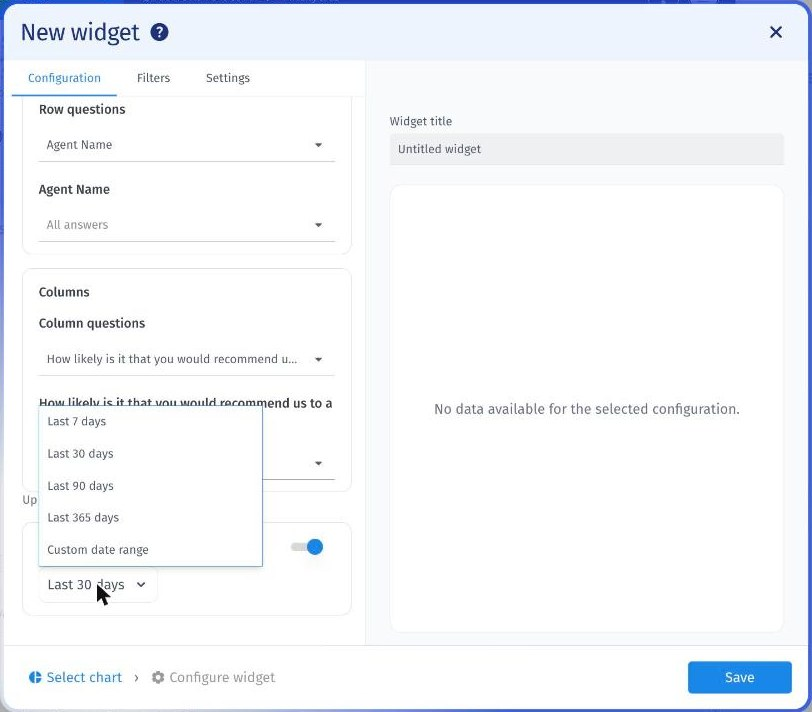
The widget uses the dashboard date filter by default. To set its own range, turn on Date range at the bottom of the Configuration tab. The options are Last 7 days, Last 30 days, Last 90 days, Last 365 days and Custom date range.
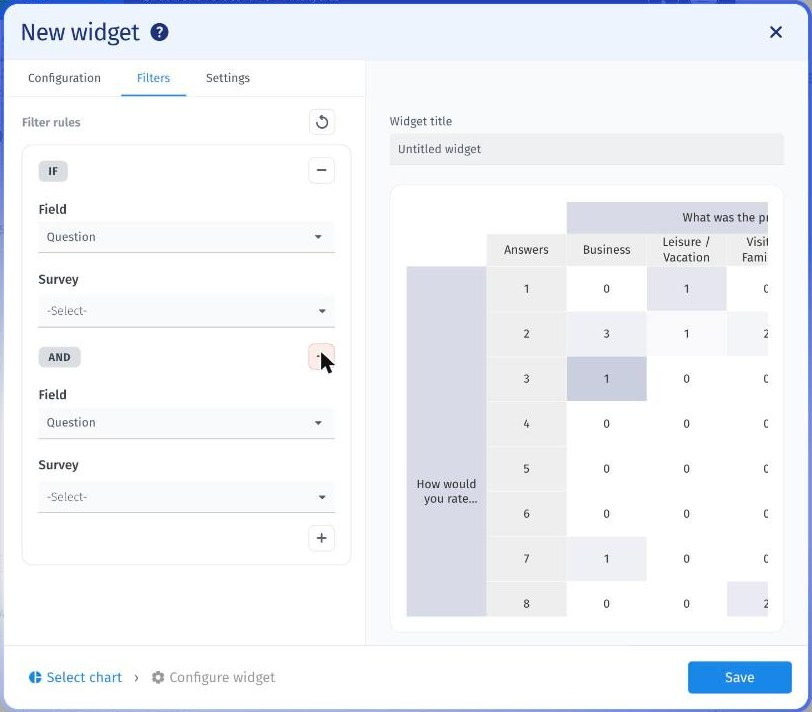
Use the Filters tab to limit the responses in the widget.
- Each rule starts with a Field: Question, Segments or Custom variable.
- Click + to add a rule. Rules are joined with AND, so a response must meet all of them.
- Click - to remove a rule, or the reset icon to clear them.
The Settings tab controls what each cell shows. When more than one value is on, each cell stacks them: count, then Row % in orange, then Column % in blue.
Cell values
- Count: Responses in each cell. On by default.
- Row %: Share of the row total. Off by default.
- Column %: Share of the column total. Off by default.
Totals
- Row totals: Total column after each column question. On by default.
- Column totals: Total row after each row question. On by default.
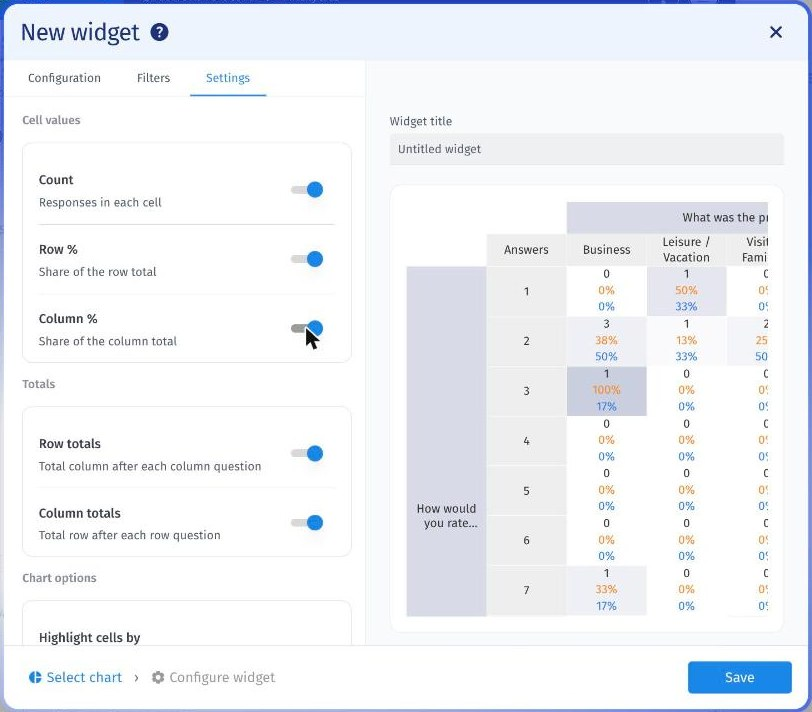
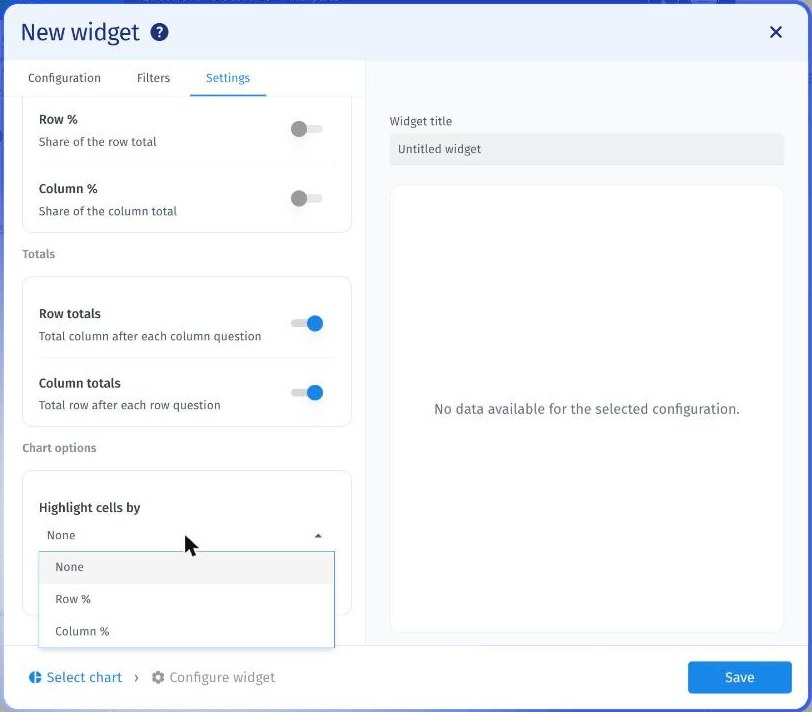
Chart options
- Highlight cells by: Shades cells by None, Row % or Column %. Set to None by default.
- Theme: Applies a selected theme to the widget. Off by default.
Read a cell by its row answer and its column answer. For example, a count of 3 under Business in the row for rating 2 means 3 respondents chose Business as their purpose of travel and gave a satisfaction rating of 2.
- Row %: Of everyone who gave this row answer, the share who gave this column answer.
- Column %: Of everyone who gave this column answer, the share who gave this row answer.
Darker cells have a higher value for the option selected in Highlight cells by.
- Choose Row % when you are comparing row answers, and Column % when you are comparing column answers.
- Check counts alongside percentages. A 100% cell can come from a single response.
- Keep the question count low so the table stays easy to scan.
- Use the answer dropdowns to hide options you do not need.
How many questions can I add?
Up to 10 across rows and columns combined.
Can I use the same question in rows and columns?
No. A question selected in Rows is not offered in Columns.
Can I use more than one survey?
No. Each widget uses one survey.
Why did my questions disappear?
Changing the survey clears your row and column questions. Select them again for the new survey.
Why do I see "No data available for the selected configuration"?
No responses match your setup. Check the survey, date range and filters.
What does "Select at least one row question" mean?
The widget needs at least one row question and one column question before it can show a preview.
