

- Custom Variable Widget
- Priority Matrix
- Heatmap Widget
- Grid Widget
- Weighted mean widget
- Comment List widget
- Widget Filters
- Ranking List Widget
- Distribution Chart
- NPS Widget
- Trend Widget
- Word Cloud Widget
- Cross tab widget
- KPI Comparison Widget
- Bubble chart
- Custom Metric Trend Chart
- Trend Comparison Widget

Heat Map Widget
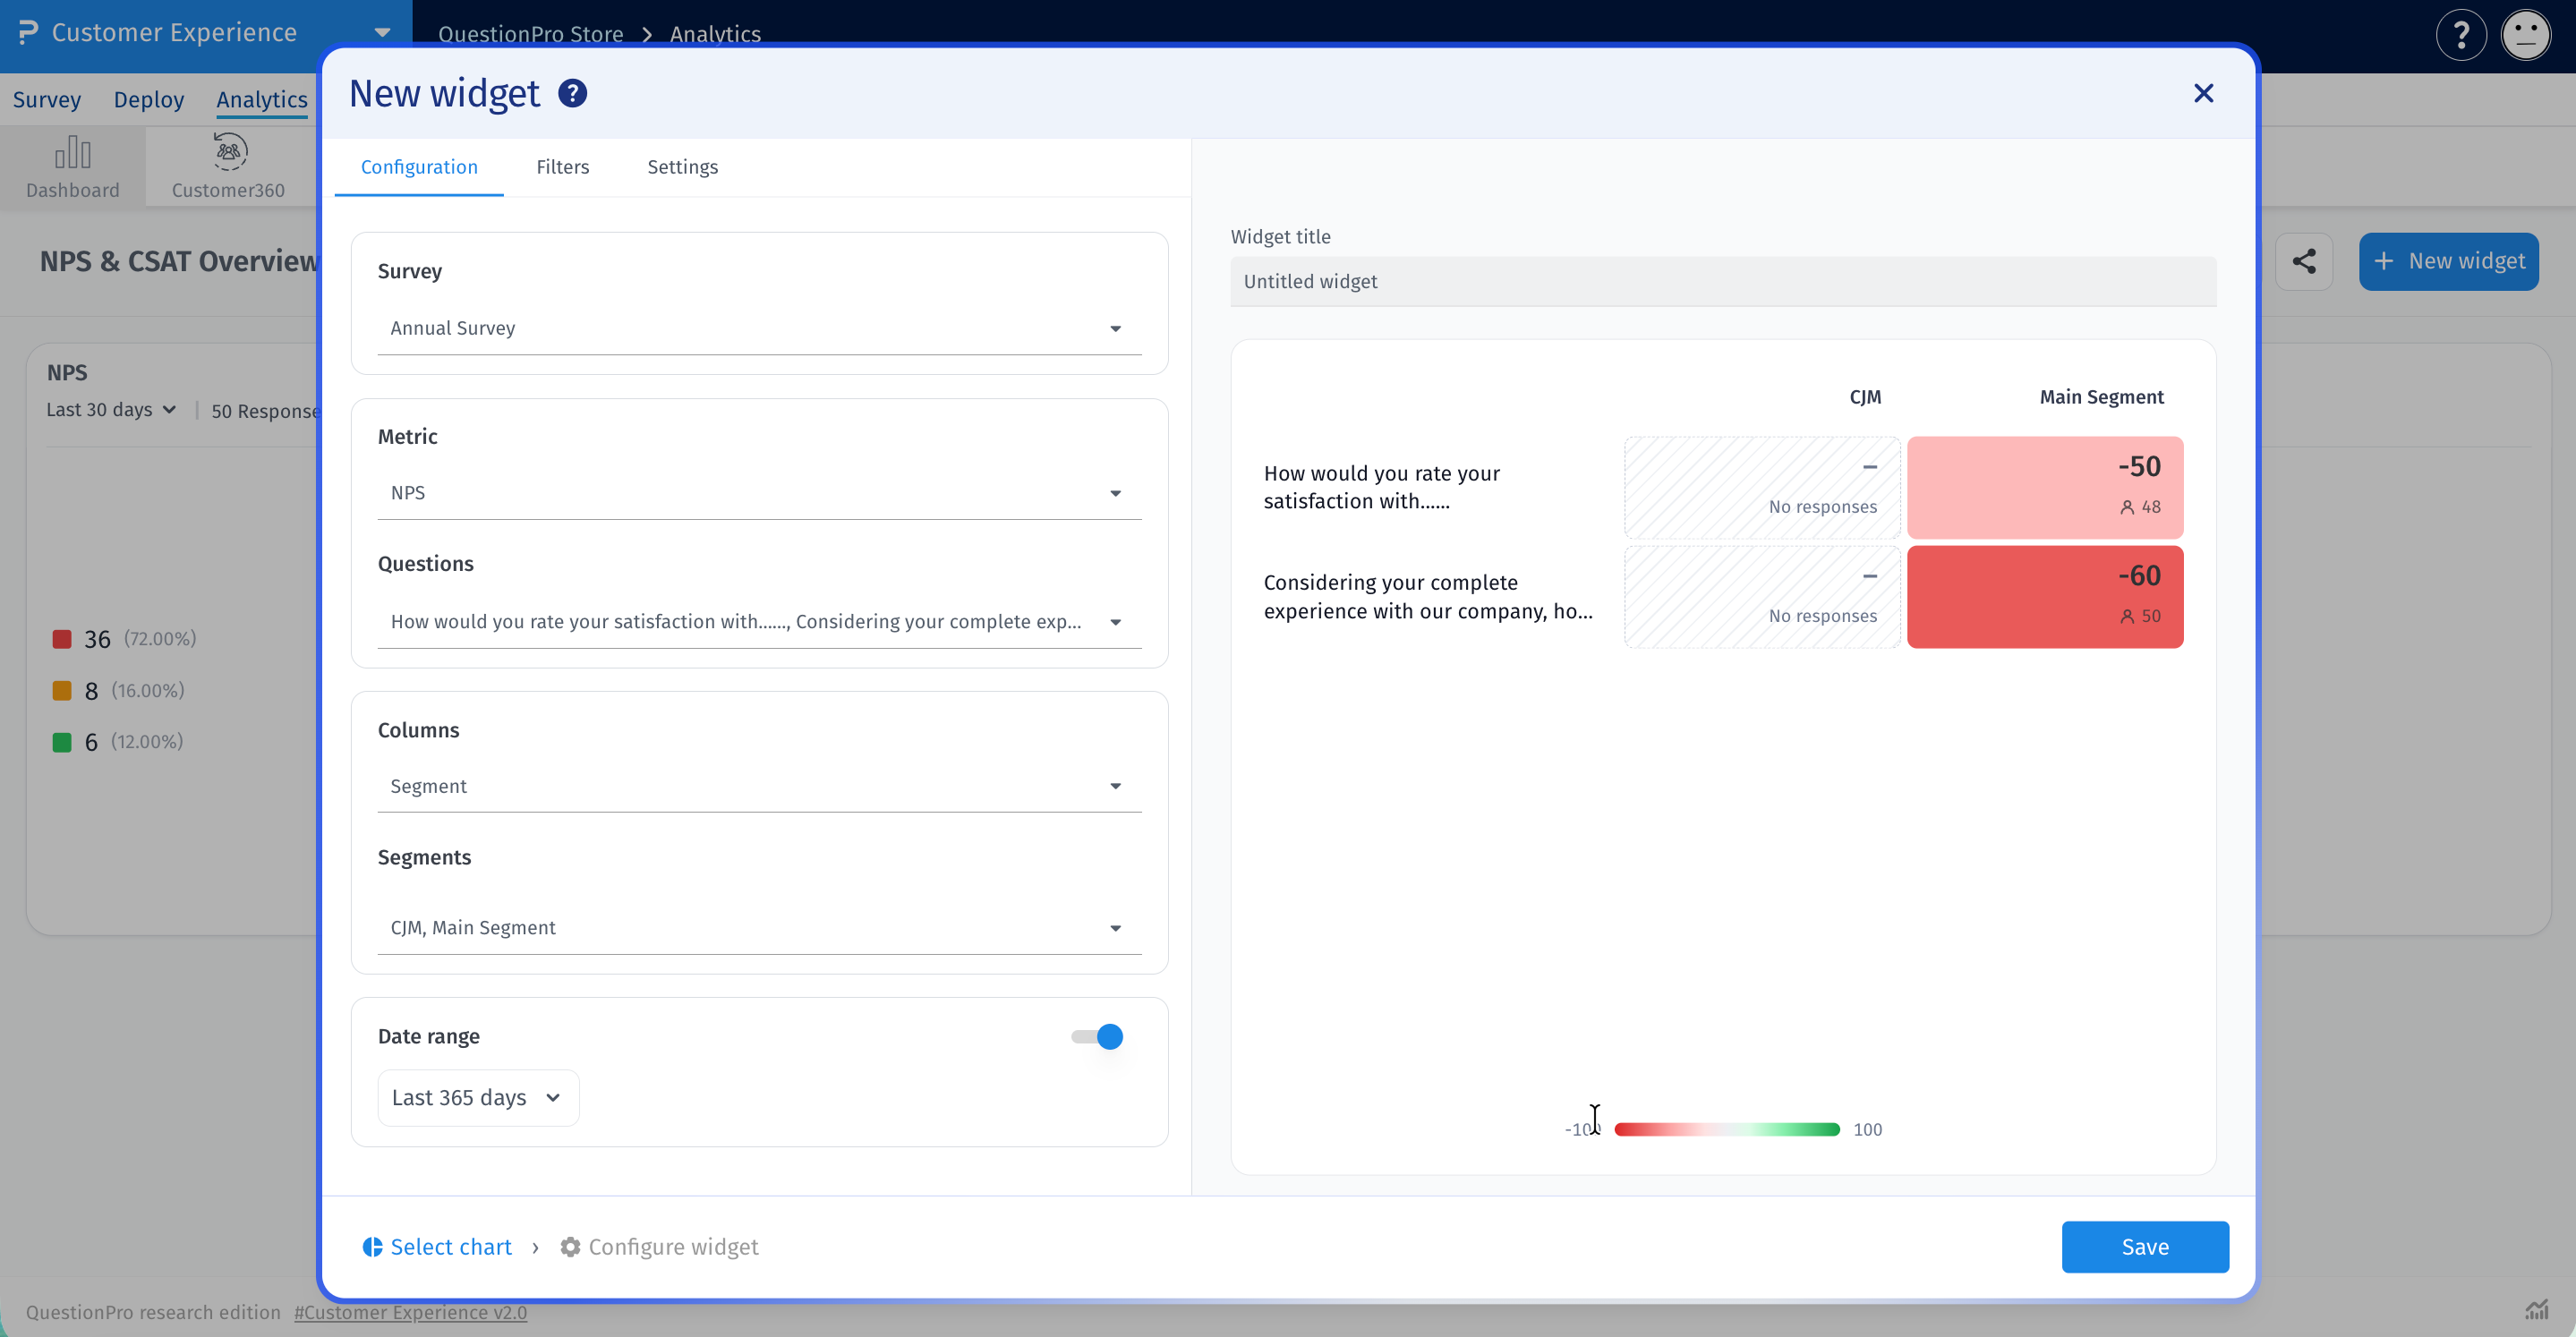
The Heat map widget shows one metric across a grid of survey questions and segments or answers. Each cell shows the score and its response count, and its color shows how high or low the score is.
Use it to spot strong and weak areas at a glance, such as NPS by purpose of travel. The widget supports NPS, CSAT, Mean, CES and Custom metric.
-
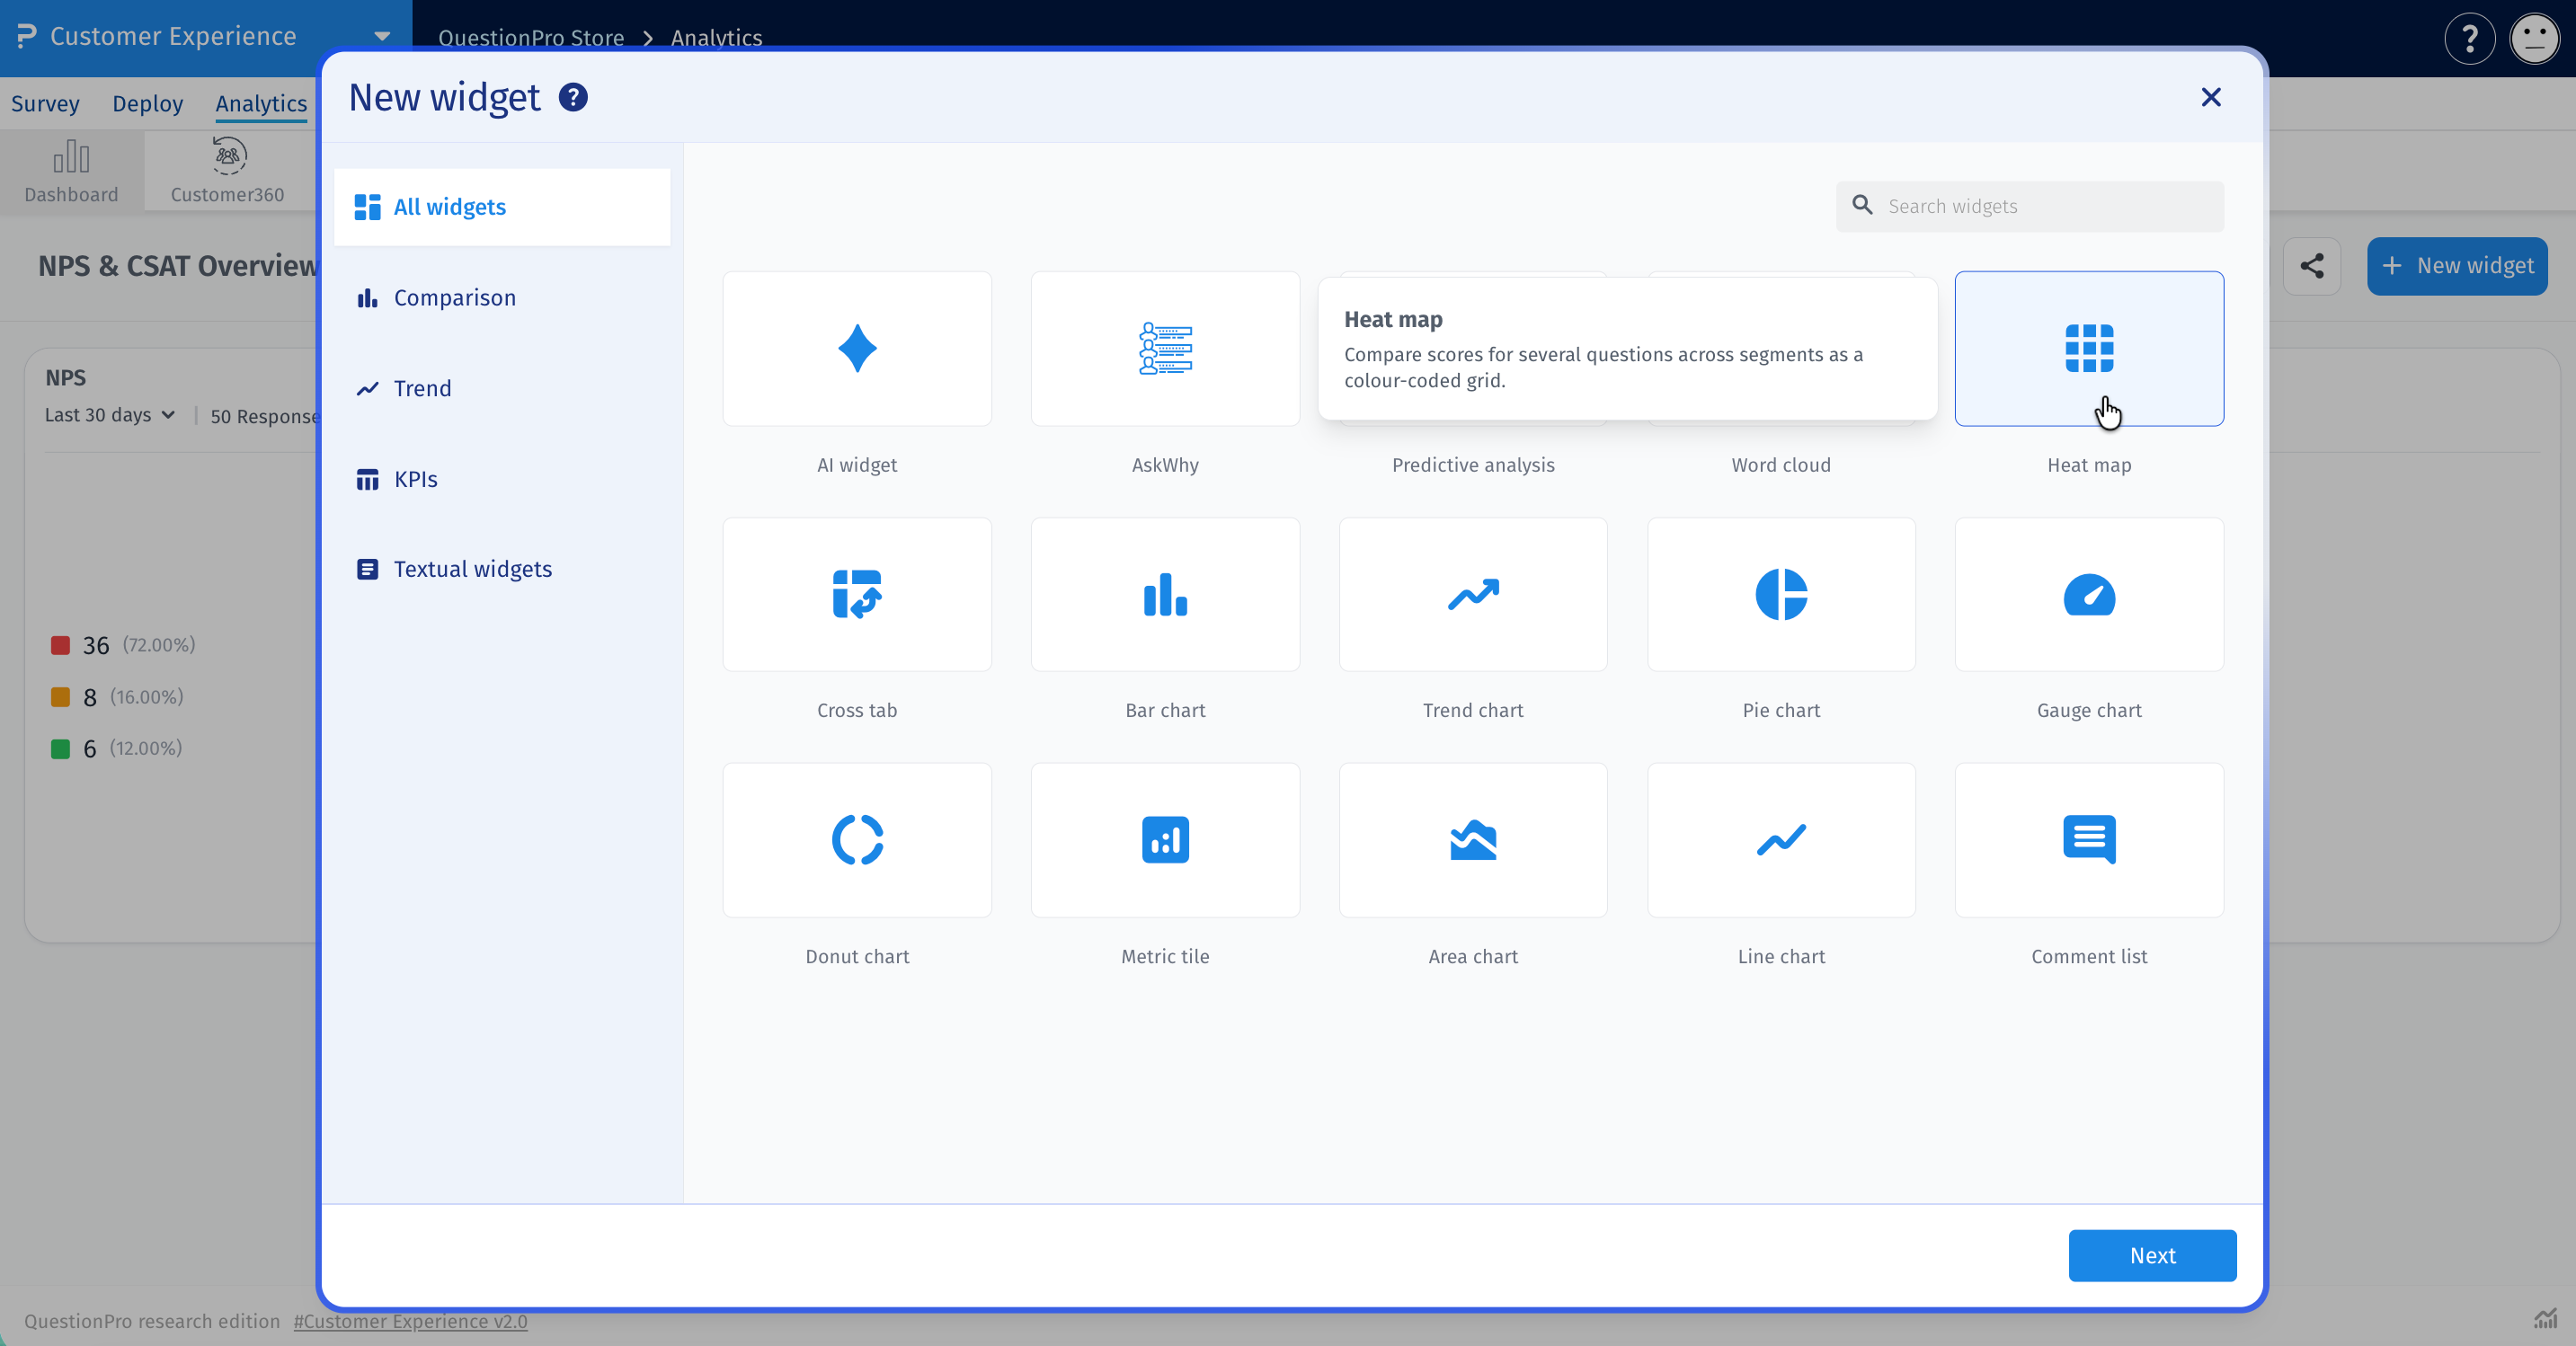
Go to Analytics > Dashboard, open your dashboard and click New widget. Select Heat map. It is also listed under the Comparison category. The configuration screen opens as soon as you select it.

-
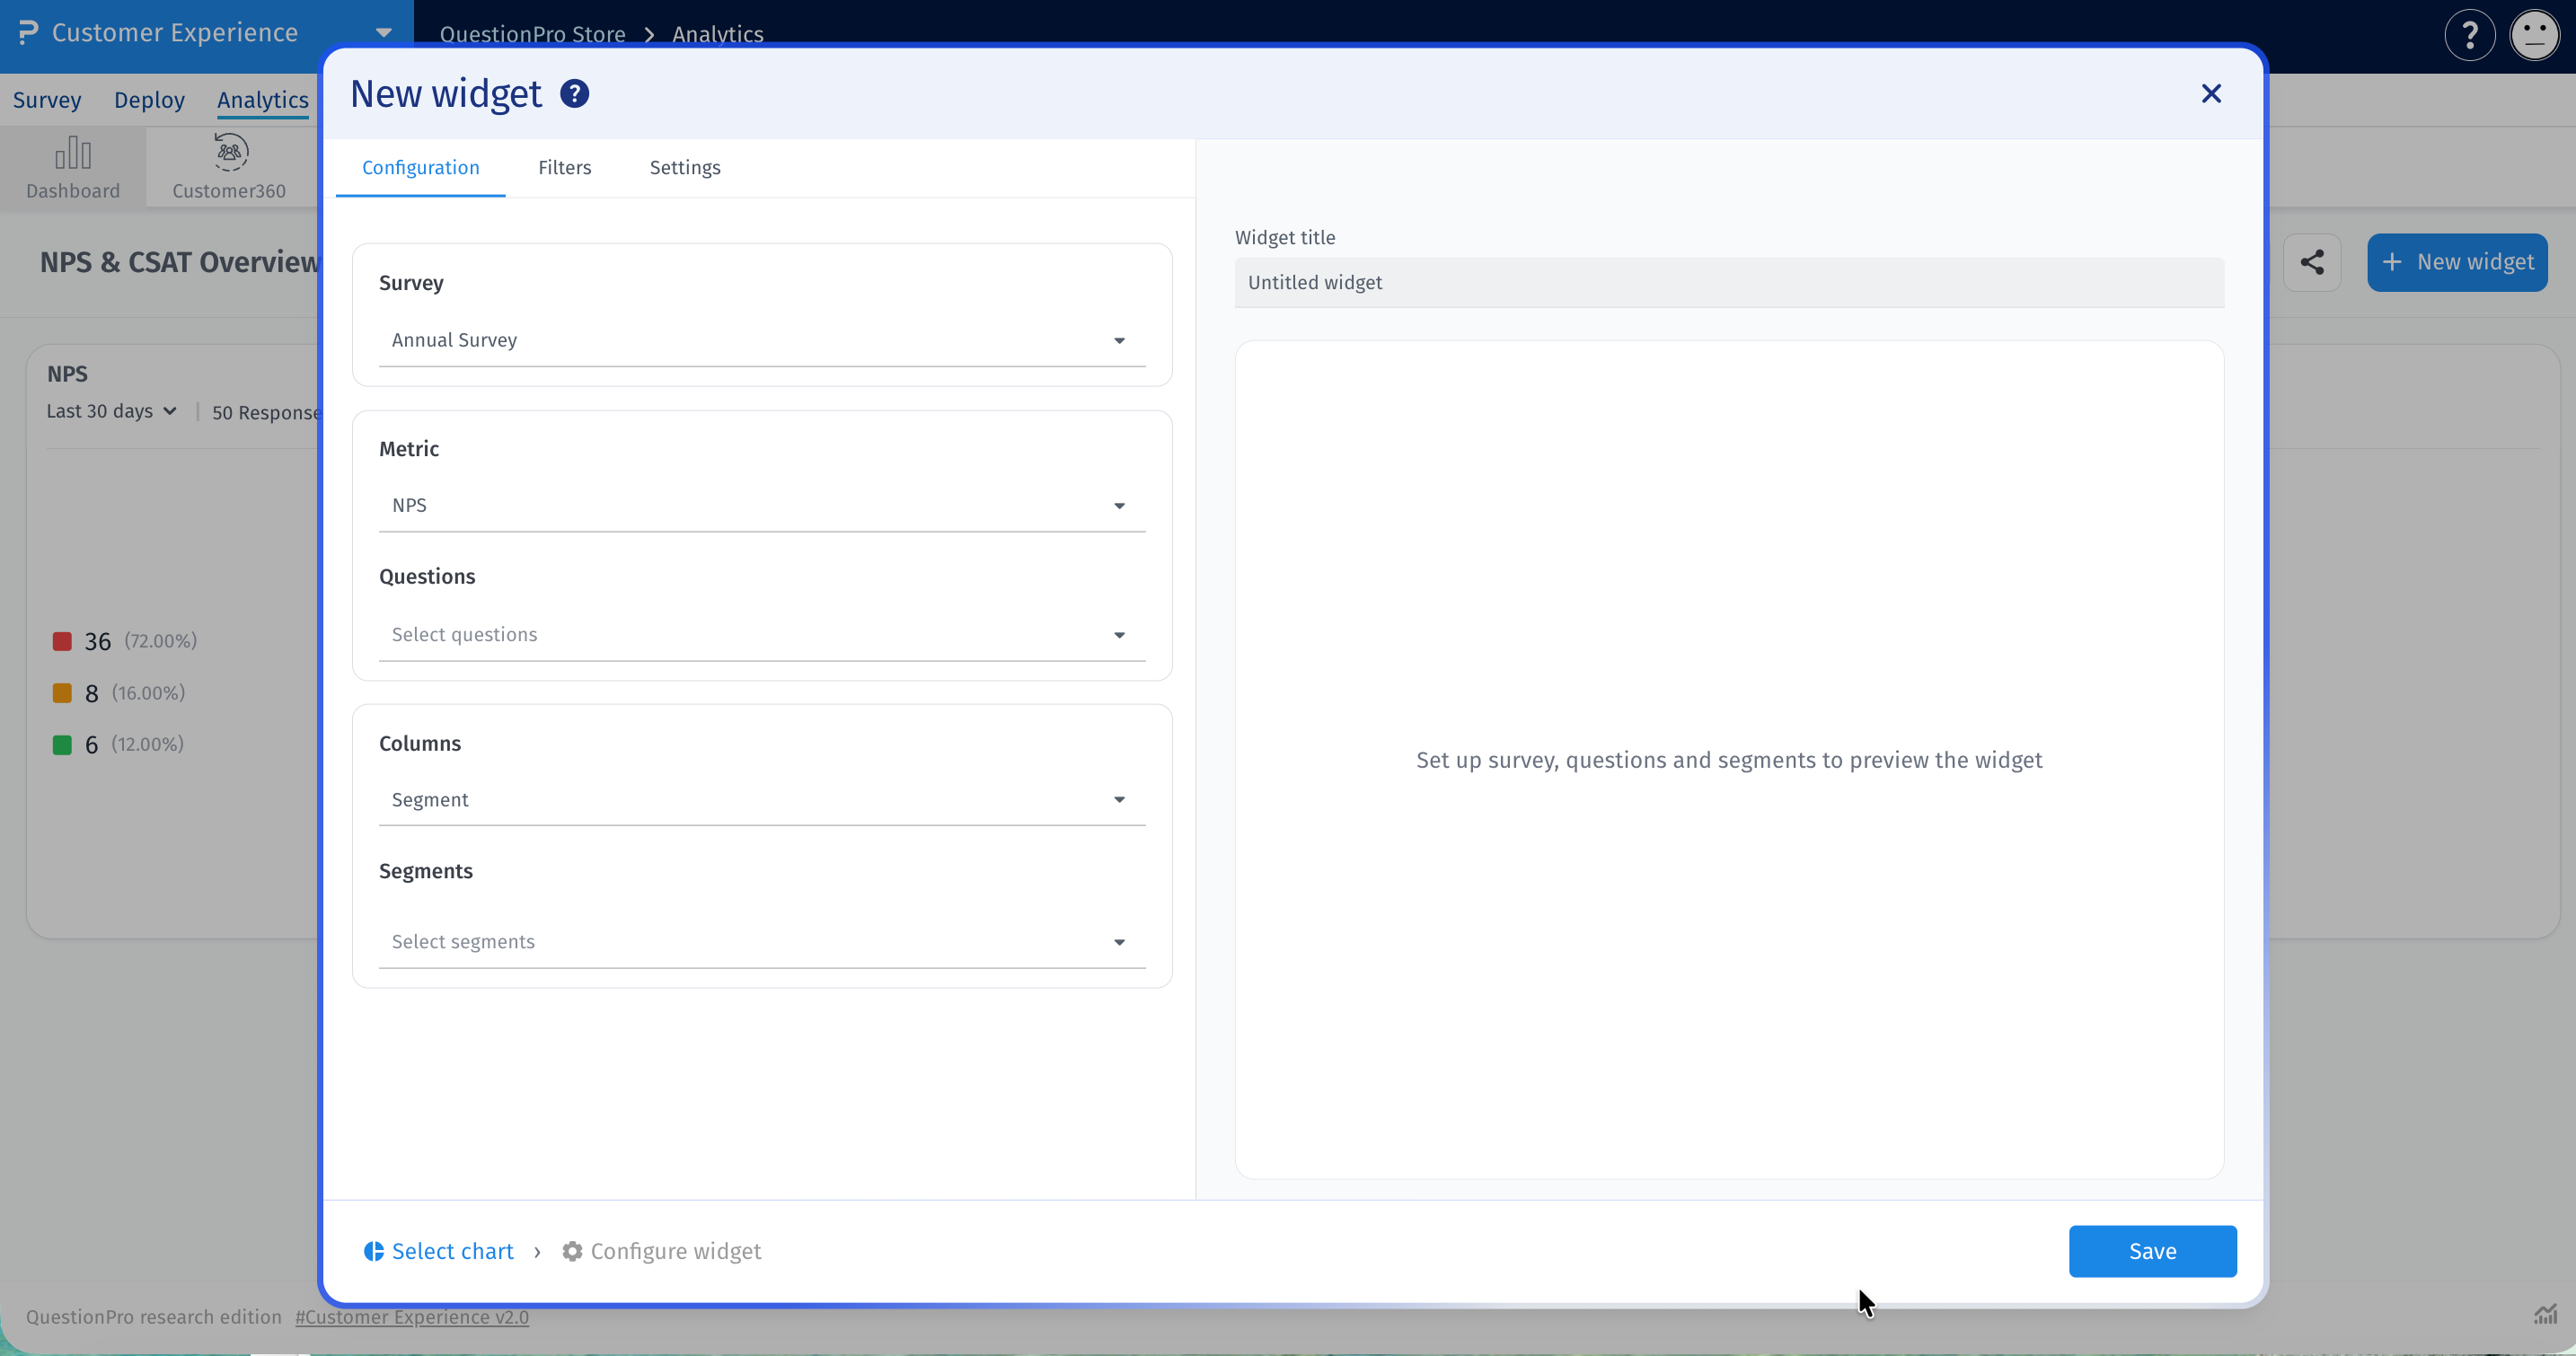
On the Configuration tab, choose one survey from the Survey dropdown. The Metric and Columns sections then appear.
-
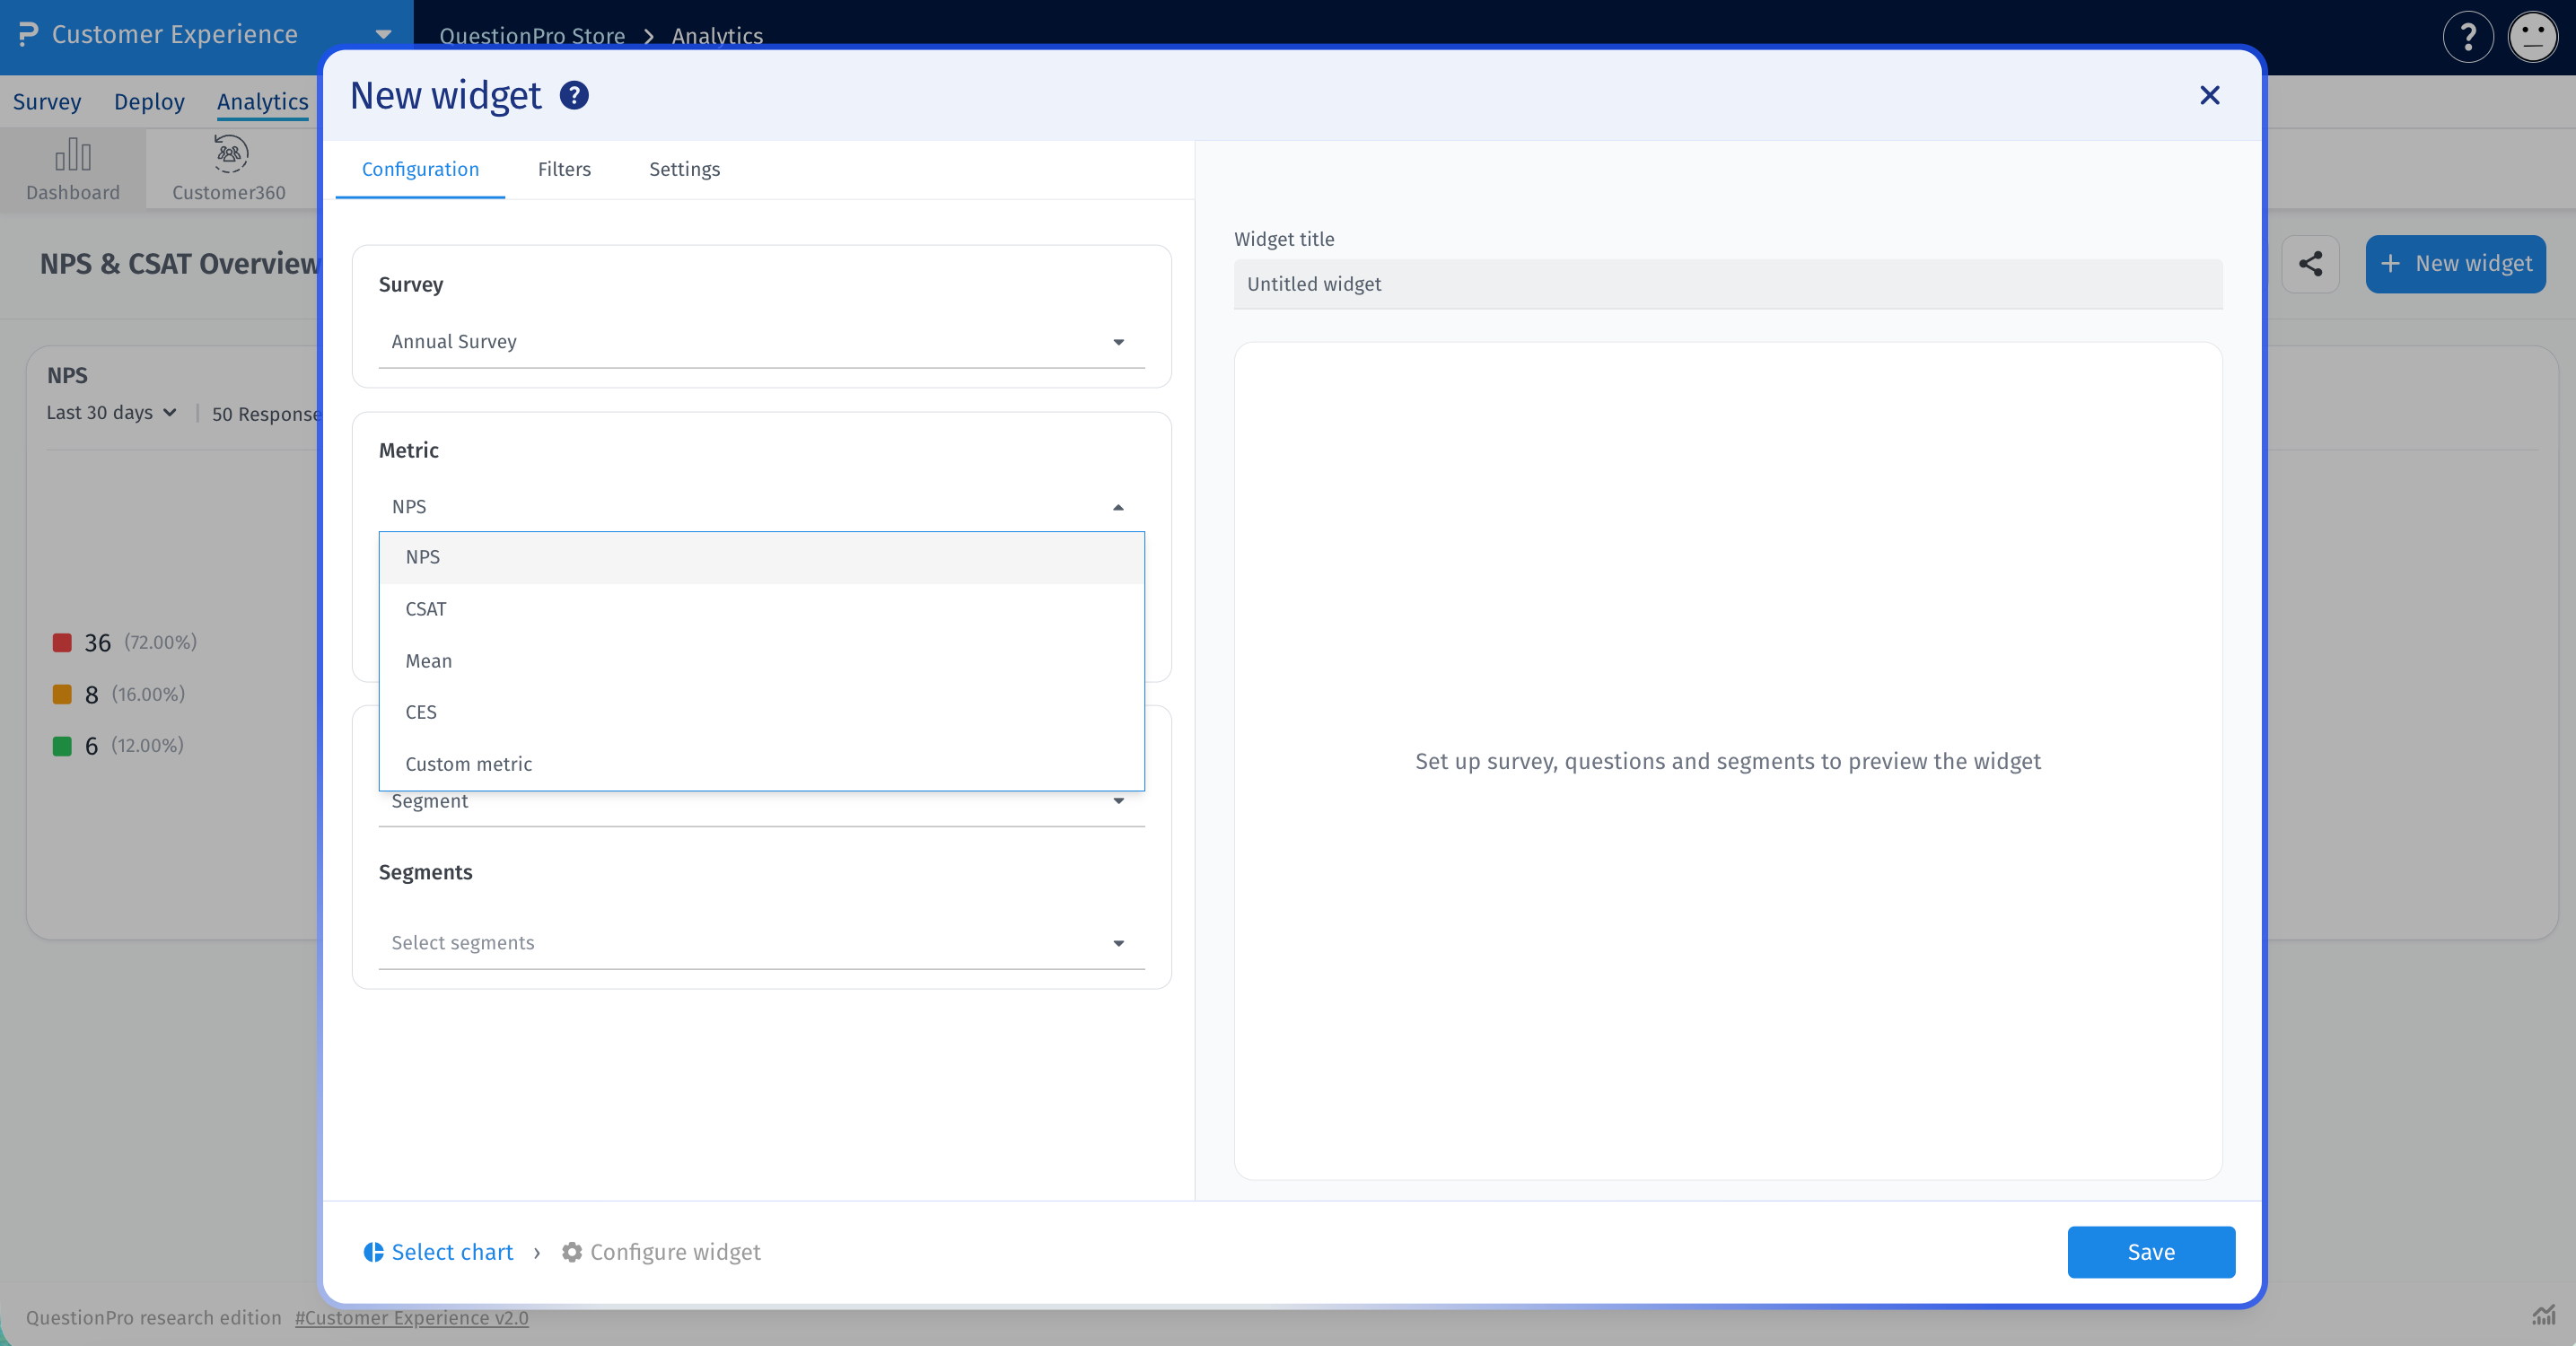
Under Metric, select NPS, CSAT, Mean, CES or Custom metric.
-
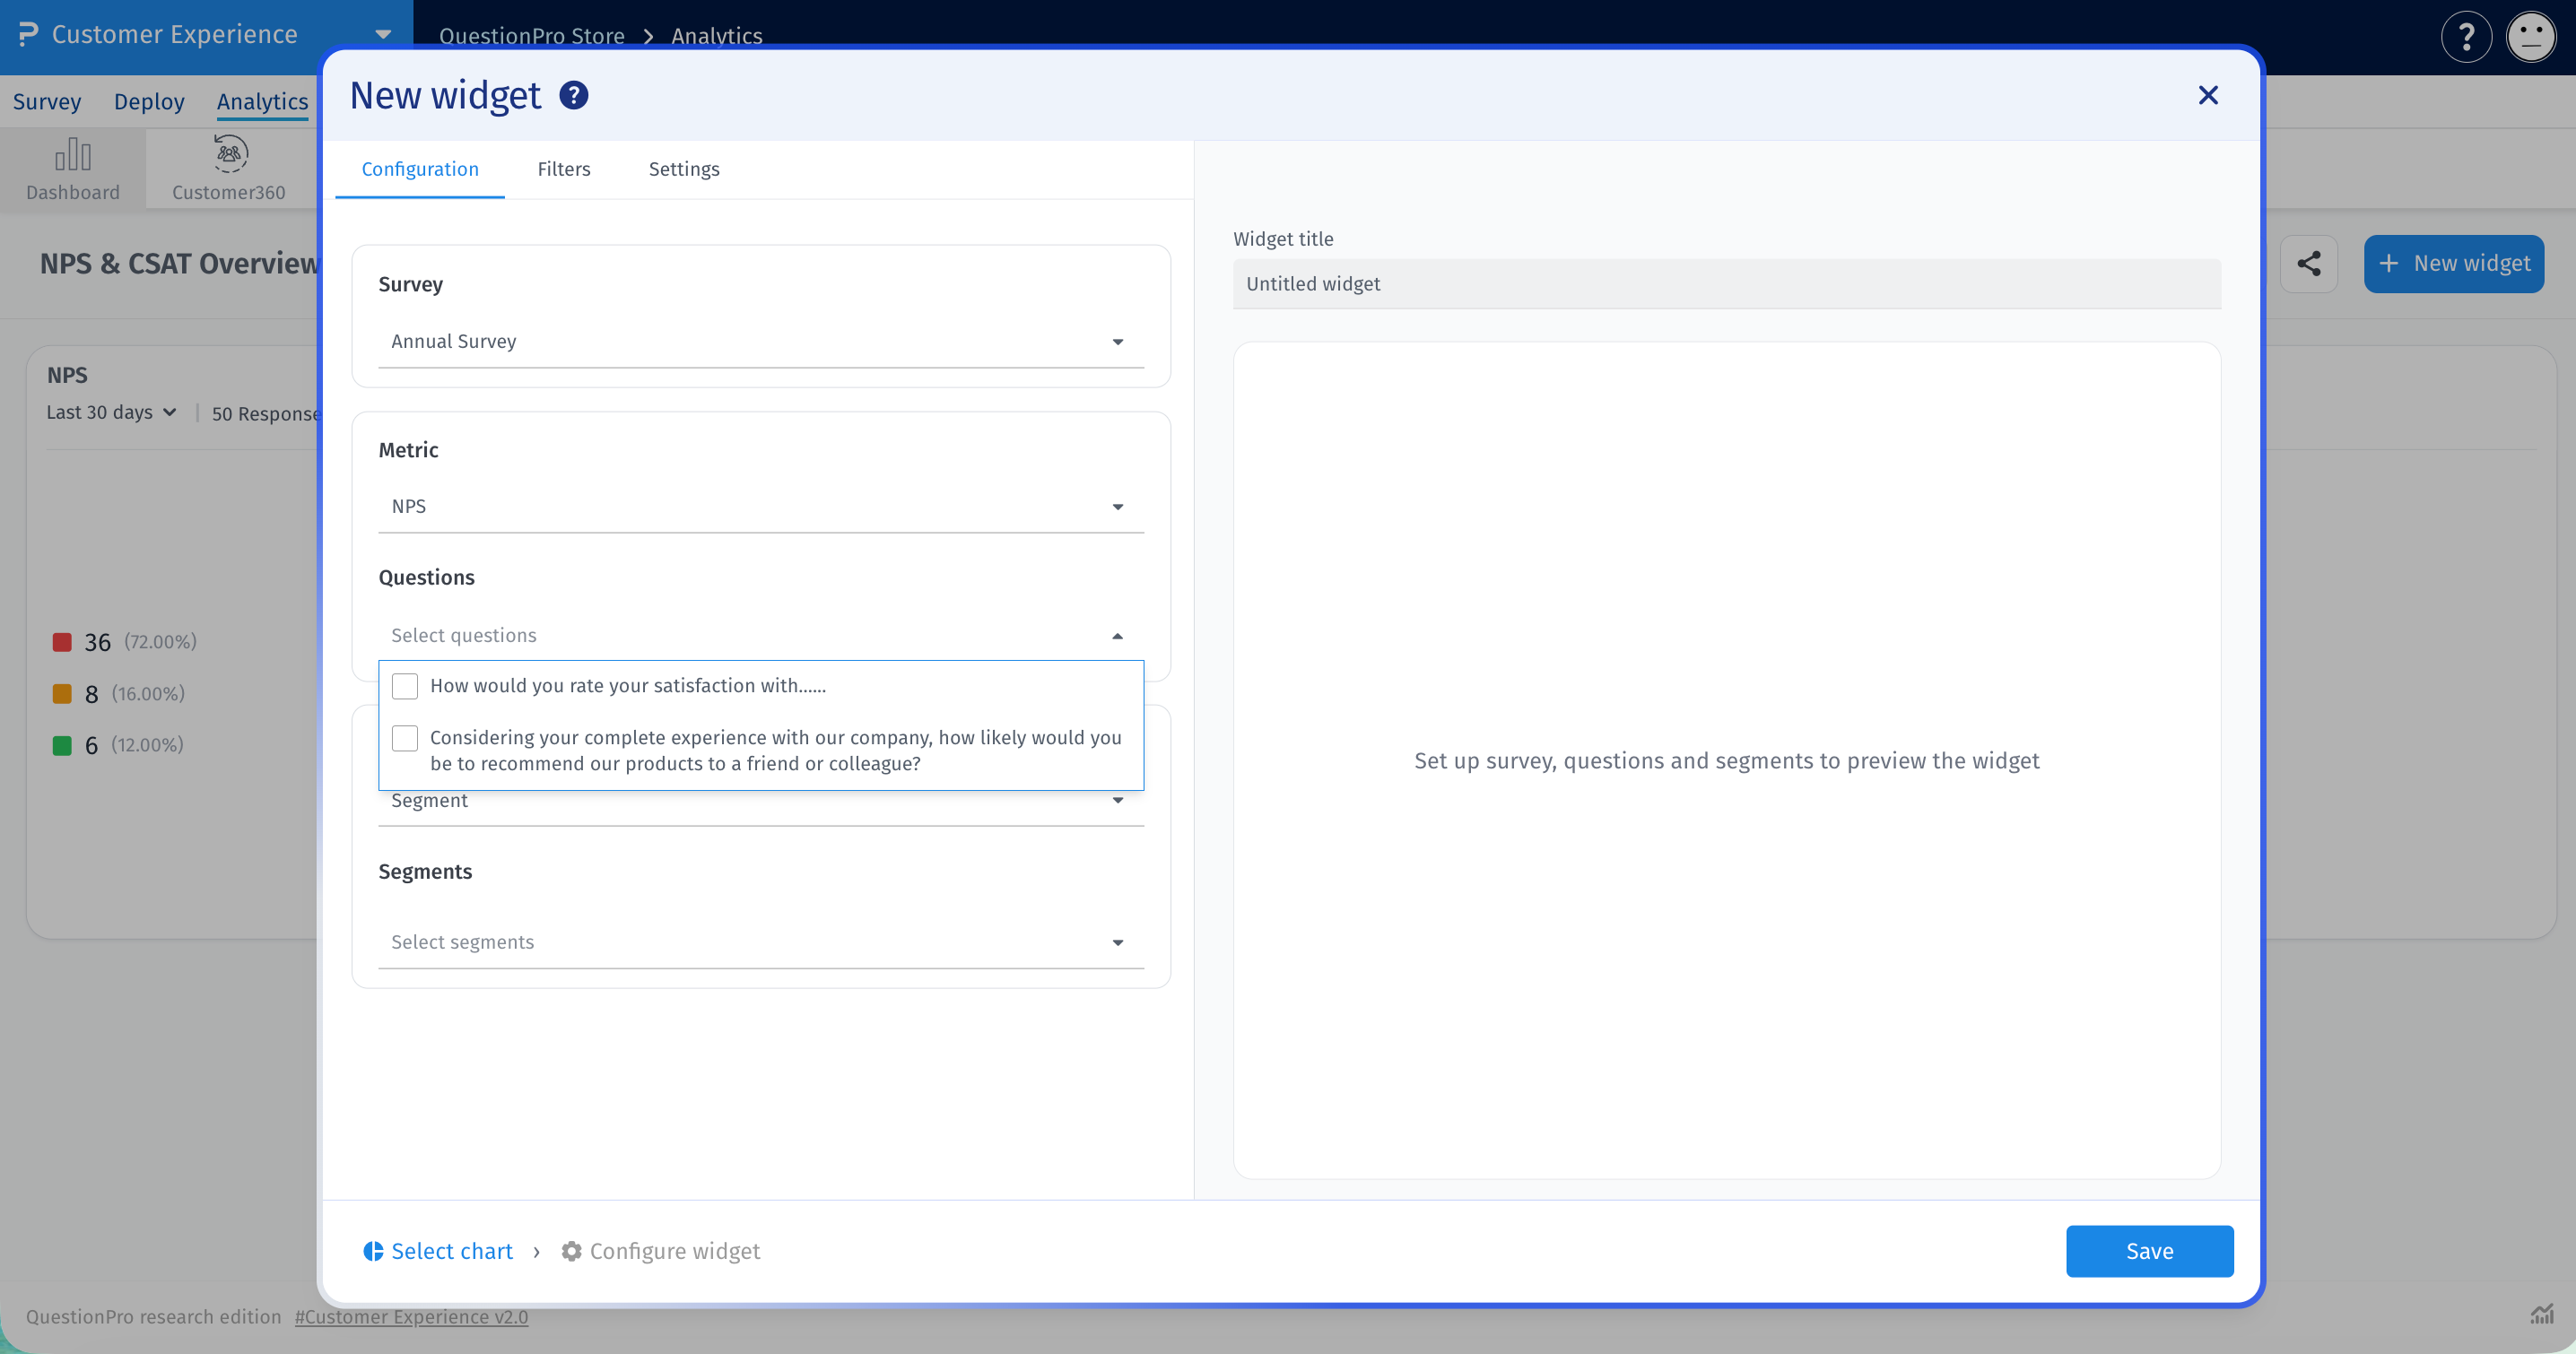
Tick one or more questions in Questions. Each question becomes a row in the grid. If you choose Custom metric, pick from Custom metrics instead. The survey needs at least one configured custom metric.
-
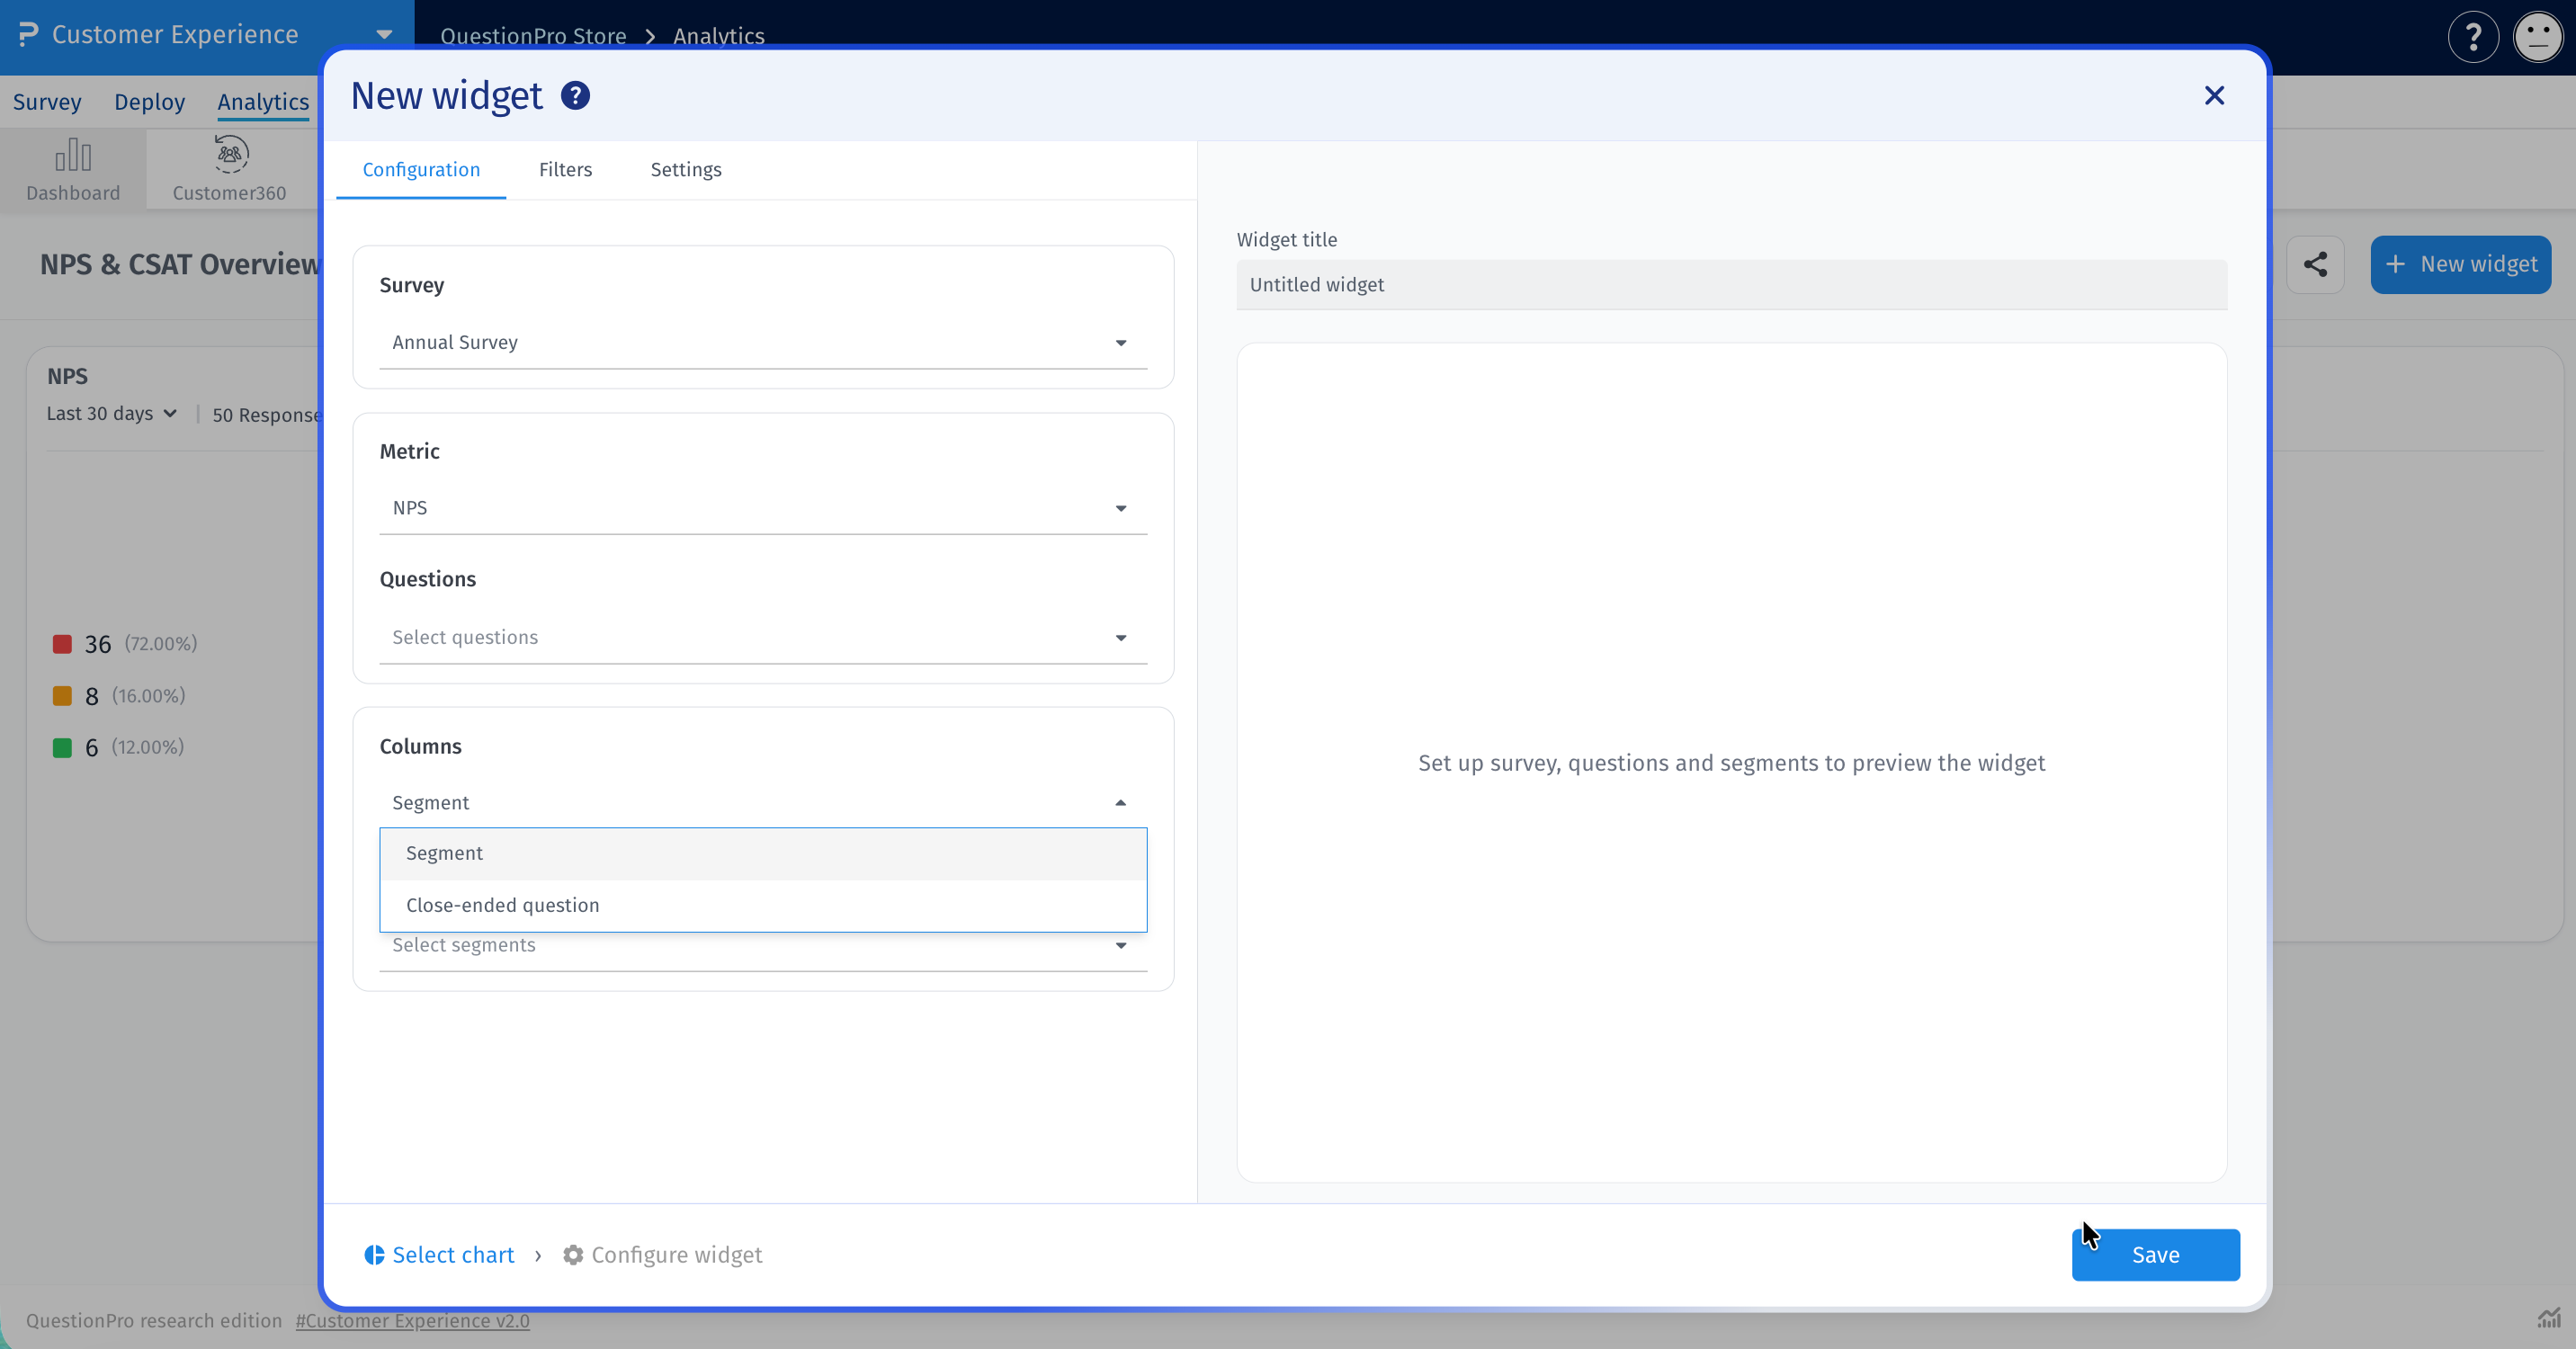
Under Columns, choose Segment or Close-ended question.
- Segment: Tick segments in Segments, or use Select All.
- Close-ended question: Pick one Column question. Use Answers to limit it to specific answers, or leave it on All answers.
-
Check the preview. The grid appears on the right. Add a name in Widget title.
- Set any date range, filters and display options you need, then click Save.
The widget uses the dashboard date filter by default. To set its own range, turn on Date range on the Configuration tab.
Use the Filters tab to limit the responses in the widget. Each rule starts with a Field: Question, Segments or Custom variable. Click + to add a rule. Rules are joined with AND.
The Settings tab controls what the grid displays.
- Tooltip: Shows values on hover. On by default.
- Question labels: Shows text beside each question. On by default.
- Segment labels: Shows the name beside each segment. With a Close-ended question column, this is Answer labels. On by default.
- Questions as columns: Swaps the rows and columns. Off by default.
- Check the response count before acting on a strong color. A score from a few responses can swing widely.
- Use Questions as columns when you have long answer labels or many answers.
- Choose questions that suit the metric you selected.
Can I use more than one survey?
No. Each widget uses one survey.
Can I compare questions across segments?
Yes. Set Columns to Segment and tick the segments you want.
Why does Custom metric show "This survey has no custom metrics configured"?
The selected survey has no custom metrics. Choose another metric or survey.
Why do some cells say No responses?
No responses match that question and column in the selected date range and filters.
