- Custom Variable Widget
- Priority Matrix
- Heatmap Widget
- Grid Widget
- Weighted mean widget
- Comment List widget
- Widget Filters
- Ranking List Widget
- Distribution Chart
- NPS Widget
- Trend Widget
- Word Cloud Widget
- Cross tab widget
- KPI Comparison Widget
- Bubble chart
- Custom Metric Trend Chart
- Trend Comparison Widget

Intercept Analytics
Intercept Analytics is a project-level dashboard that shows how visitors respond to the intercepts in a project: who saw them, who opted in, and who completed the survey.
Use it to:
- Compare intercepts
- Find where visitors drop off
- See which audiences respond best
- Select your workspace.
- Select your project.
- In the side navigation, click Analytics.
The dashboard opens with data for all intercepts in the project.
- See the headline numbers: AI summary and summary metrics
- Spot changes over time: Trend over time
- See how visitors reacted to the intercept: Opt-in button actions
- Find where visitors drop off: View to response funnel
- Compare audiences: Device types and New vs returning
- See where views come from: Top referral URLs and Views by country
- Check browser and system performance: Browsers and Operating systems
- Compare intercepts: Performance by intercept
Use the controls at the top of the page, or select a value inside a widget. Every filter updates all the widgets together.
Filter by intercept
- Open the Intercept filter dropdown.
- Search or scroll, and select an intercept. The dashboard shows only that intercept.
- To return to the project view, select All intercepts.
Filter by date range
The default period is the last 30 days.
- Open the Date range control.
- Select Custom Range, Last week, Last month, Last quarter or Last year.
- Click Apply.
To return to the default, click Reset.
Filter from a widget
- Select a row, bar or country in a widget. For example, select Desktop in Device types.
- Check the label under the top controls, such as Device: Desktop. Every card now shows data for that value.
- To remove the filter, click Clear filters.
Note: Selecting a row in Performance by intercept changes the Intercept filter instead of adding a label. To undo it, select All intercepts in the dropdown.
Snapshot downloads the analytics as an image. If you want your filters in the image, apply them first.
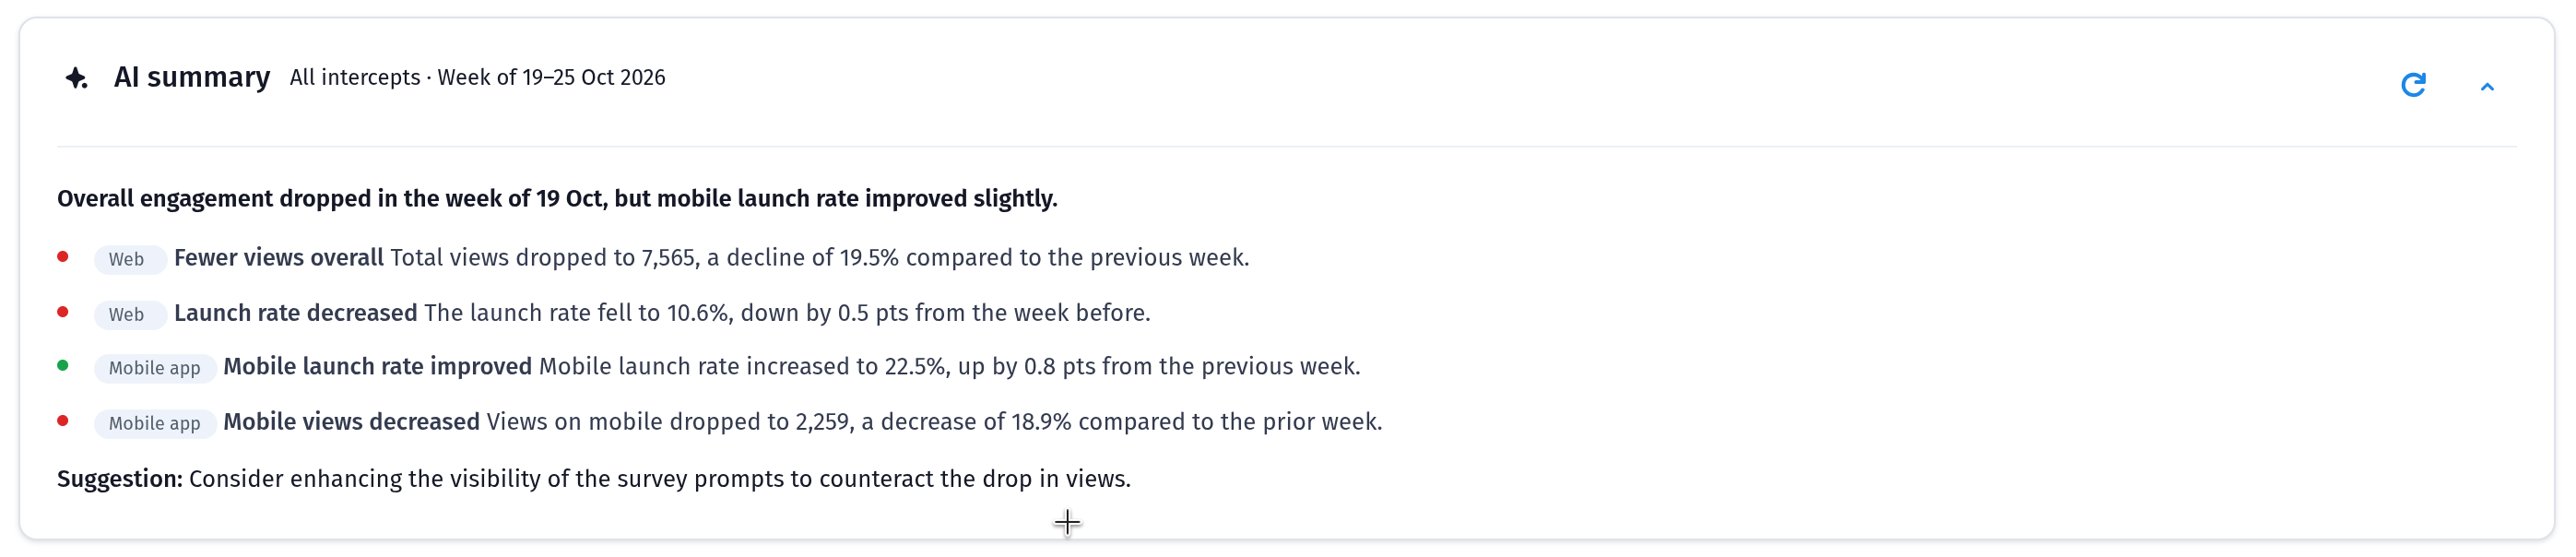
The AI summary card sits at the top of the dashboard and is labeled with the intercept selection. Use the arrow on the right to collapse or expand it.
Until visitors start viewing and interacting with your intercepts, it shows a "We're getting things ready!" message.
Five cards give you the headline numbers for the selected intercepts and dates.
- Daily unique visitors: Unique visitors, added up across each day in the date range.
- Intercept views: How many times intercepts were shown.
- Launch rate: The share of views that launched the survey (Launches ÷ Intercept views). The card also shows the clicked and auto-launched counts.
- Completed: How many surveys were completed from intercepts.
- Completion rate: The share of launched surveys that were completed (Completed ÷ Launches).

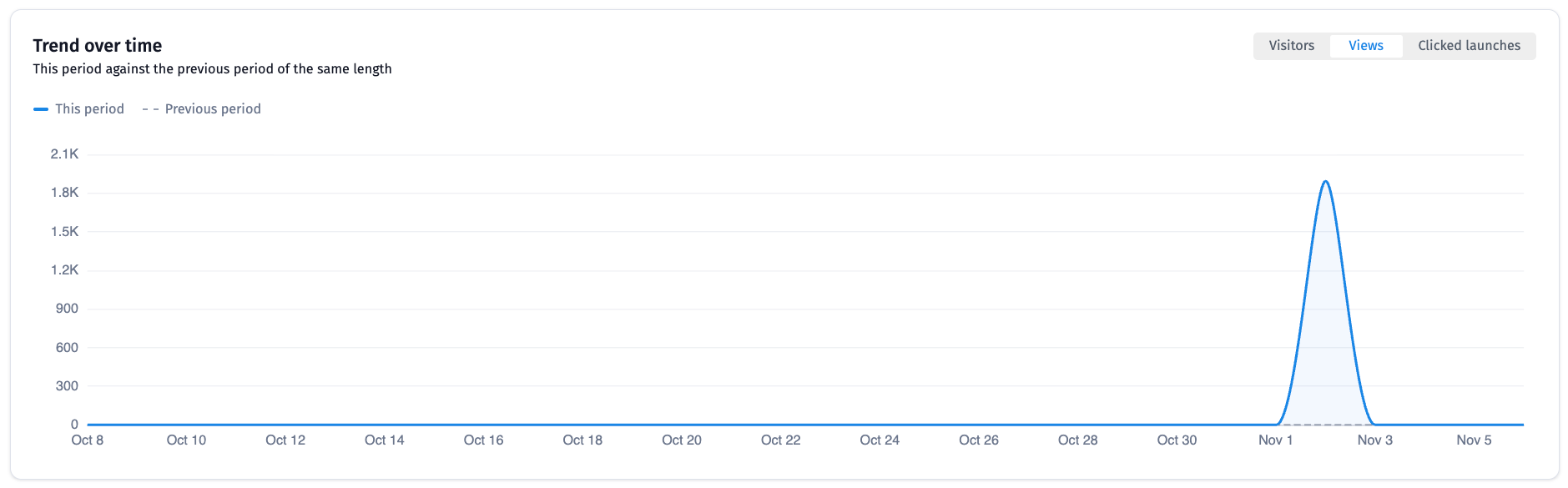
This line chart compares the selected period (solid line) with the previous period of the same length (dashed line). Use it to spot spikes, dips and changes after you edit or publish an intercept.
Use the switch at the top right to chart Visitors, Views or Clicked launches.
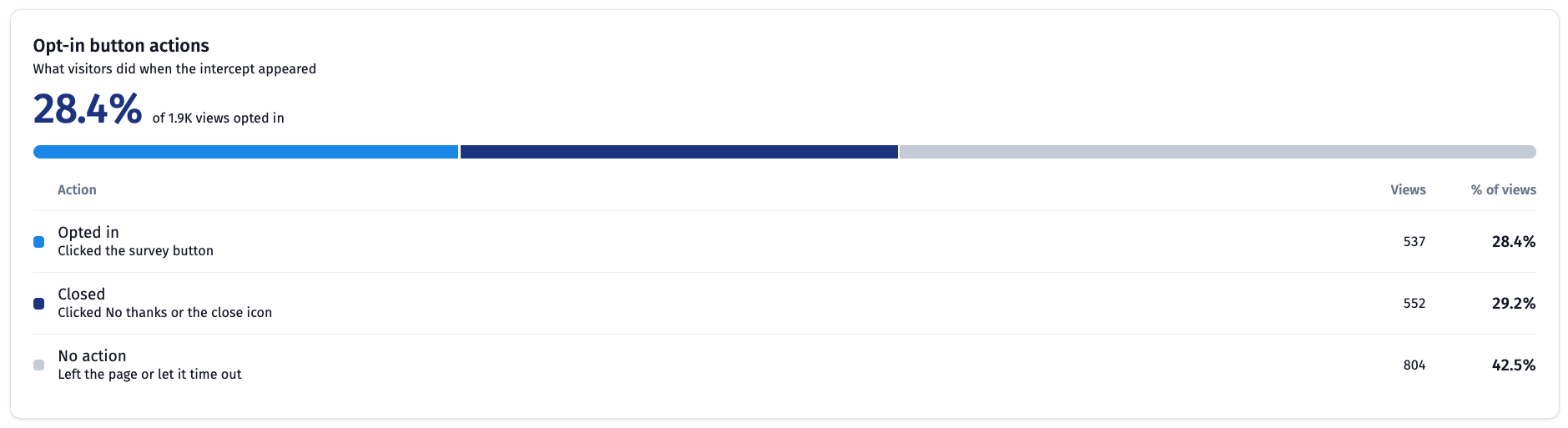
This widget shows what visitors did when the intercept appeared. The large percentage is the share of views that opted in, and the bar splits all views across three actions.
- Opted in: The visitor clicked the survey button.
- Closed: The visitor clicked No thanks or the close icon.
- No action: The visitor left the page or let the intercept time out.
How to read it:
- A high Closed share can mean the message or timing isn't landing.
- A high No action share can mean visitors aren't noticing the intercept.
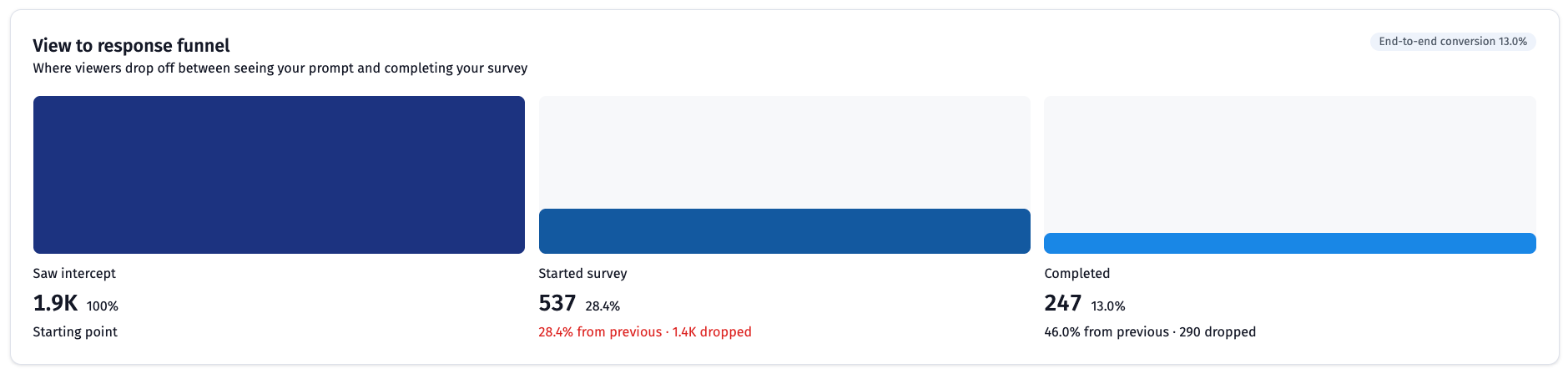
This funnel shows where viewers drop off between seeing your prompt and completing your survey. It has three stages: Saw intercept, Started survey and Completed.
Each stage shows:
- Its count
- Its share of all views
- Its conversion from the previous stage
- How many people dropped
The End-to-end conversion label at the top right is the share of views that became completed surveys.
The Device types, Browsers, Operating systems and Top referral URLs widgets cover web intercepts only. Mobile app intercepts do not report this data.
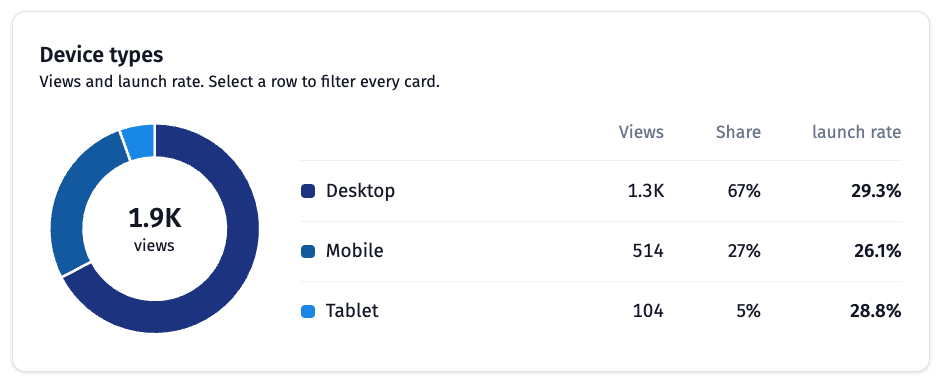
This donut chart splits views by Desktop, Mobile and Tablet. The table lists each device's views, share of views and launch rate.
Use it to see whether an intercept works better on some devices. Select a row to filter every card.
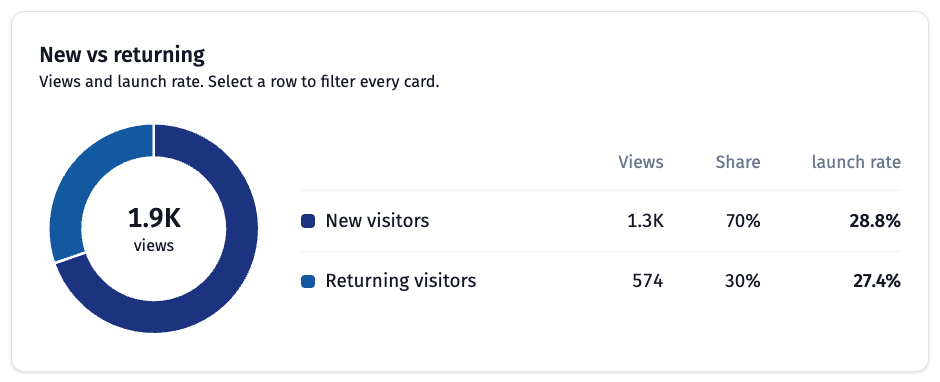
This donut chart splits views between New visitors and Returning visitors, with views, share and launch rate for each.
Use it to see whether first-time or repeat visitors are more likely to respond. Select a row to filter every card.
This bar chart lists the referring URLs behind your views, with the views and launch rate beside each bar. Traffic with no referrer information appears as Unknown.
Select a bar to filter every card.
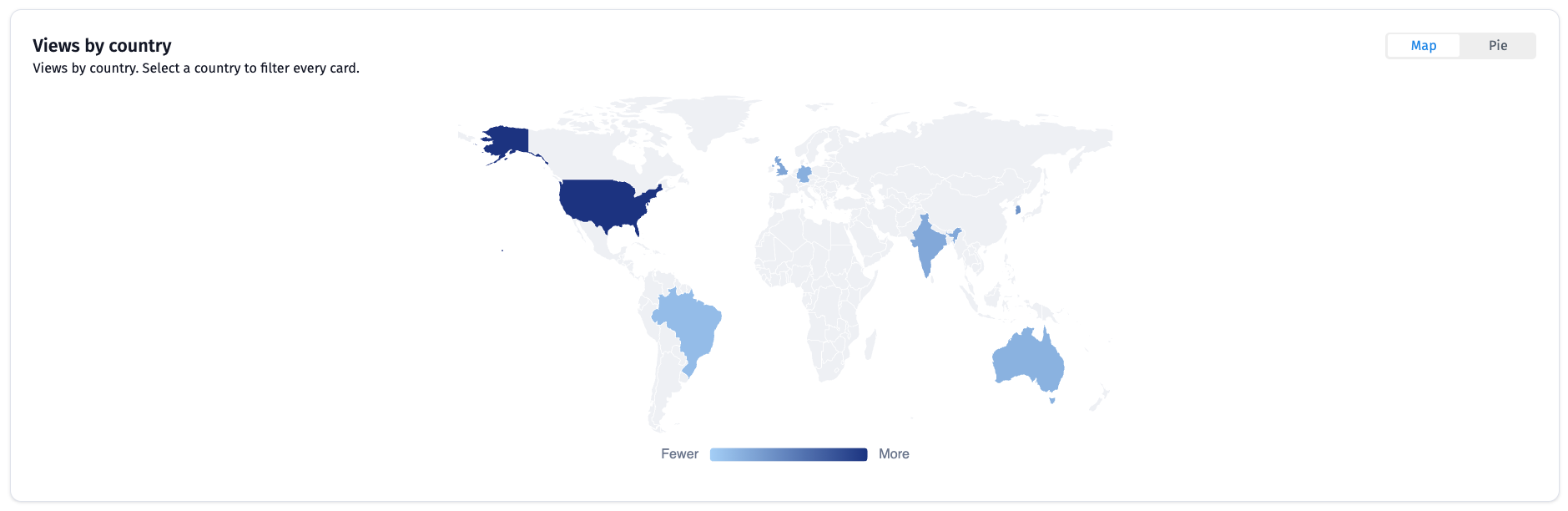
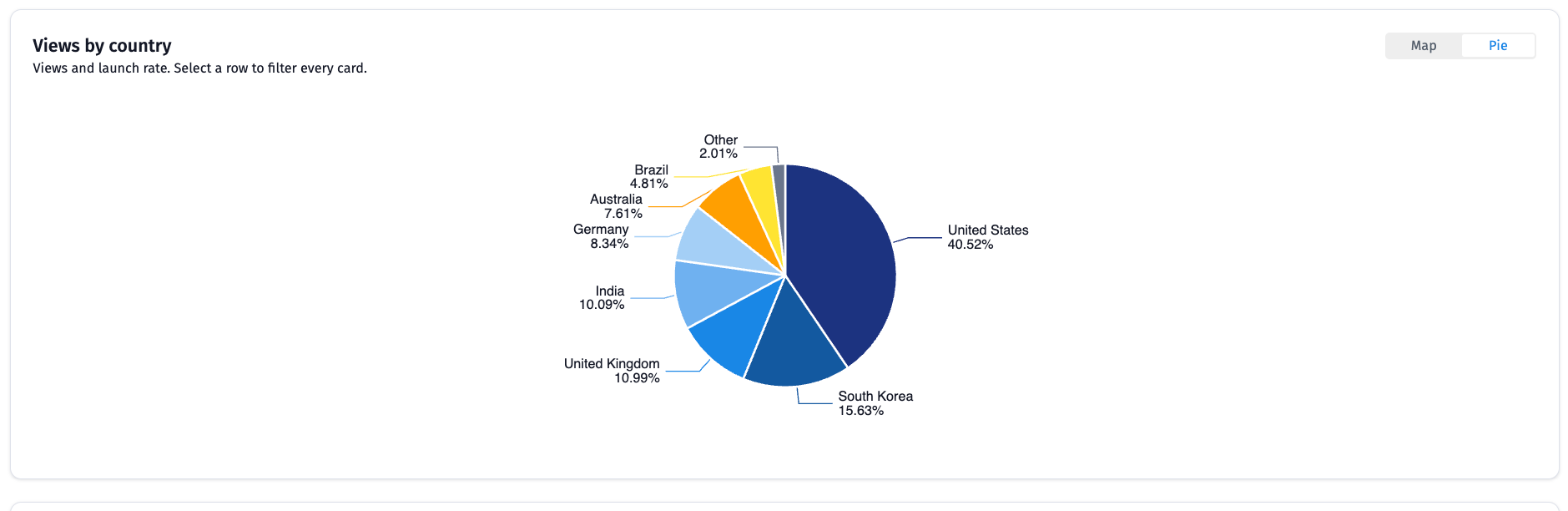
This widget shows where views come from. Use the switch at the top right to change the view.
-
Map: Countries are shaded from Fewer to More views. Select a country to filter every card.

-
Pie: Each slice shows a country's share of views, with smaller countries grouped as Other.
This bar chart ranks browsers by views, with the views and launch rate beside each bar.
Use it to check whether an intercept performs differently in one browser. Select a bar to filter every card.

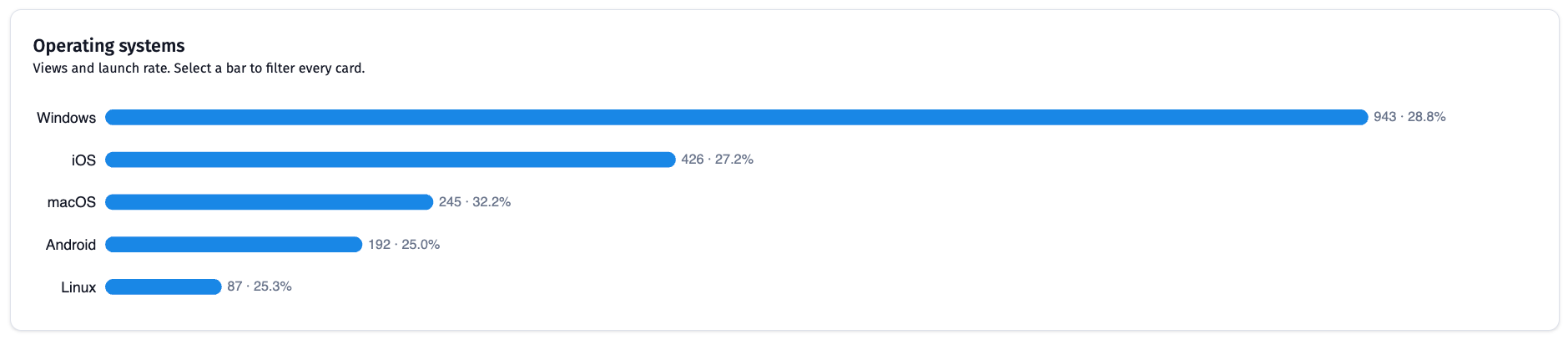
This bar chart ranks operating systems by views, with the views and launch rate beside each bar.
Select a bar to filter every card.
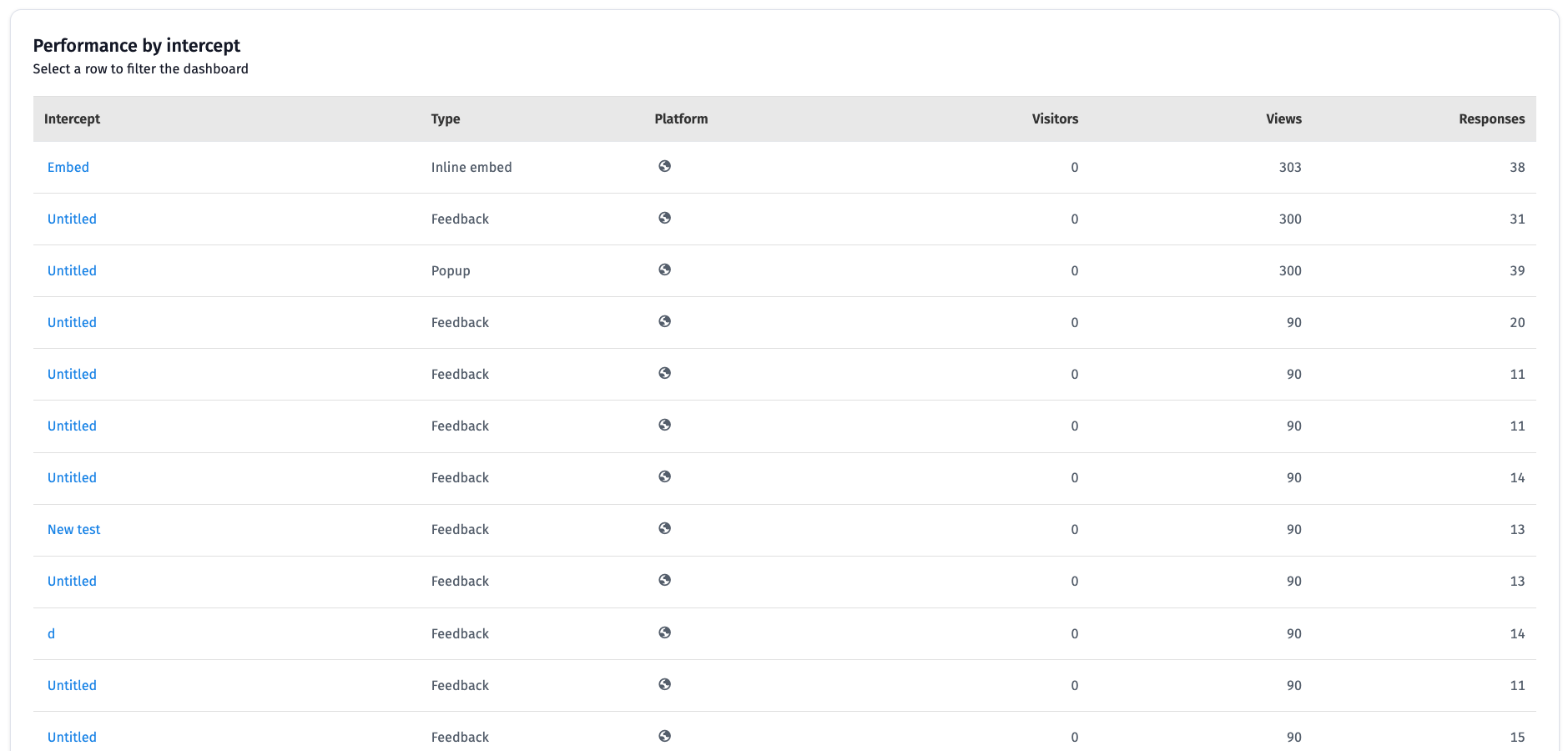
This table compares every intercept in the project so you can see which ones work best.
- Intercept: The intercept's name.
- Type: The intercept format, such as Popup, Feedback, Prompt or Inline embed.
- Platform: An icon showing where the intercept runs.
- Visitors: Visitors for that intercept.
- Views: How many times the intercept was shown.
- Responses: Responses collected through that intercept.
Select a row to filter the whole dashboard to that intercept.