

- Media library
- Question limits
- Creating a survey from MS Word doc
- How to edit live surveys
- Survey blocks
- Survey block randomizer
- Question randomization
- Scale Library
- What is monadic testing?
- What is sequential monadic testing?
- Extraction Support for Image Chooser Question Types
- What is comparison testing?
- Custom validation messages
- Survey Builder with QuestionPro AI
- Testing Send
- Survey Preview Options
- Add Questions From a Document
- Survey Authoring 2025
- Standard question types
- Multiple choice question type
- Text question- comment box
- Matrix multi-point scales question type
- Rank order question
- Smiley-rating question
- Image question type
- Date and time question type
- reCAPTCHA question type
- Net Promoter Score question type
- Van Westendorp's price sensitivity question
- Choice modelling questions
- Side-By-Side matrix question
- Homunculus question type
- Predictive answer options
- Presentation text questions
- Multiple choice: select one
- Multiple choice: select many
- Page timer
- Contact information question
- Matrix multi-select question
- Matrix spreadsheet question
- Closed card sorting question
- Flex Matrix
- Text Slider Question Type
- Graphical Rating Scales
- Rank Order - Drag and Drop
- Bipolar Matrix - Slider
- Bipolar Matrix Likert Scale
- Gabor Granger
- Verified Digital Signature
- Star Rating Question Type
- Push to social
- Attach Upload File Question
- Constant Sum Question
- Video Insights
- Platform connect
- Communities Recruitment
- TubePulse
- Open Card Sorting
- Map Question Type
- VideoAI
- Answer type
- Reorder questions
- Question tips
- Text box next to question
- Text question settings
- Adding other option
- Matrix question settings
- Image rating question settings
- Scale options for numeric slider question
- Constant sum question settings
- Setting default answer option
- Exclusive option for multiple choice questions
- Validate question
- Bulk validation settings
- Remove validation message
- Question separators
- Question Code
- Page breaks in survey
- Survey introduction with acceptance checkbox
- RegEx Validation
- Question Library
- Embed Media
- Slider Start Position
- Answer Display - Alternate Flip
- Matrix - Auto Focus Mode
- Text validations
- Numeric Input Settings- Spreadsheet
- Answer Groups
- Hidden Questions
- Decimal Separator Currency Format
- Allow Multiple Files - Attache/Upload Question Type
- Text box - Keyboard input type
- Deep Dive
- Answer Display Order
- Alternate colors
- Conjoint Best Practices
- Multi-media file limits
- Conjoint Prohibited Pairs
- Add logo to survey
- Custom Themes
- Display Settings
- Auto-advance
- Progress bar
- Automatic question numbering option
- Enabling social network toolbar
- Browser Title
- Print or export to PDF, DOC
- Survey Navigation Buttons
- Accessible Theme
- Back and Exit Navigation Buttons
- Focus Mode
- Survey Layout
- Survey Layout - Visual
- Telly Integration
- Telly Integration
- Workspace URL
- Classic Layout
- Branching - Skip Logic
- Compound Branching
- Compound or delayed branching
- Response Based Quota Control
- Dynamic text or comment boxes
- Extraction logic
- Show or hide question logic
- Dynamic show or hide
- Scoring logic
- Net promoter scoring model
- Piping text
- Survey chaining
- Looping logic
- Branching to terminate survey
- Logic operators
- Selected N of M logic
- JavaScript Logic Syntax Reference
- Block Flow
- Block Looping
- Scoring Engine: Syntax Reference
- Always Extract and Never Extract Logic
- Matrix Extraction
- Locked Extraction
- Dynamic Custom Variable Update
- Advanced Randomization
- Custom Scripting Examples
- Survey Logic Builder - AI
- Custom Scripting - Custom Logic Engine Question
- Survey settings
- Save & continue
- Anti Ballot Box Stuffing (ABBS) - disable multiple responses
- Deactivate survey
- Admin confirmation email
- Action alerts
- Survey timeout
- Finish options
- Spotlight report
- Print survey response
- Search and replace
- Survey Timer
- Allowing multiple respondents from the same device
- Text Input Size Settings
- Admin Confirmation Emails
- Survey Close Date
- Respondent Location Data
- Review Mode
- Review, Edit and Print Responses
- Geo coding
- Dynamic Progress Bar
- Response Quota
- Age Verification
- Tools - Survey Options
- Live survey URL
- Customize survey URL
- Create email invitation
- Personalizing emails
- Email invitation settings
- Email list filter
- Survey reminders
- Export batch
- Email status
- Spam index
- Send surveys via SMS
- Phone & paper
- Adding responses manually
- SMS Pricing
- Embedding Question In Email
- Deleting Email Lists
- Multilingual Survey Distribution
- SMTP
- Reply-To Email Address
- Domain Authentication
- Email Delivery Troubleshooting
- QR Code
- Email Delivery and Deliverability
- Survey Dashboard - Report
- Overall participant statistics
- Dropout analysis
- Pivot table
- Turf analysis
- Trend analysis
- Correlation analysis
- Survey comparison
- Gap analysis
- Mean calculation
- Weighted mean
- Cluster Analysis
- Dashboard filter
- Download Options - Dashboard
- HotSpot analysis
- Heatmap analysis
- Weighted Rank Order
- Cross-Tabulation Grouping Answer Options
- A/B Testing in QuestionPro Surveys
- Data Quality
- Data Quality Terminates
- Matrix Heatmap Chart
- Column proportions test
- Response Identifier
- TURF Reach Analysis
- Bulk Edit System Variables
- Weighting and balancing
- Conjoint analysis designs
- Conjoint part worths calculation
- Conjoint calculations and methodology
- Conjoint attribute importance
- Conjoint profiles
- Market segmentation simulator
- Conjoint brand premium and price elasticity
- What is MaxDiff scaling
- MaxDiff settings
- Anchored MaxDiff Analysis [BETA Release]
- MaxDiff FAQ
- MaxDiff- Interpreting Results
- Automatic email report
- Data quality - Patterned responses
- Data quality - gibberish words
- Import external data
- Download center
- Consolidate report
- Delete survey data
- Data quality - All checkboxes selected
- Exporting data to Word or Powerpoint
- Scheduled reports
- Datapad
- Notification Group
- Unselected Checkbox Representation
- Merge Data 2.0
- Plagiarism Detection
- IP based location data
- SPSS Export
- SPSS variable name
- Update user details
- Update time zone
- Teams
- Add Users
- Usage dashboard
- Single user license
- License restrictions
- Troubleshooting login issues
- Software support package
- Welcome Email
- User Roles & Permissions
- Bulk Add Users
- Two-Factor Authentication
- Network Access
- Changing ownership of the survey
- Unable to access Chat support
- Navigating QuestionPro Products
- Agency Partnership Referral Program
- Response Limits

Study Analysis
Study Analytics lets you examine your study data at multiple levels. You can view aggregate insights across all participants to identify trends and patterns, or focus on individual participant journeys to understand their complete experience. The analytics dashboard includes response timelines, thematic analysis, sentiment tracking, and word clouds to help you uncover meaningful insights from your qualitative research.
To access Study Analysis, open your study and click the Analytics tab in the left-hand sidebar. This opens the Analytics dashboard with two main views: Overview for aggregate insights and Responses for detailed response data.
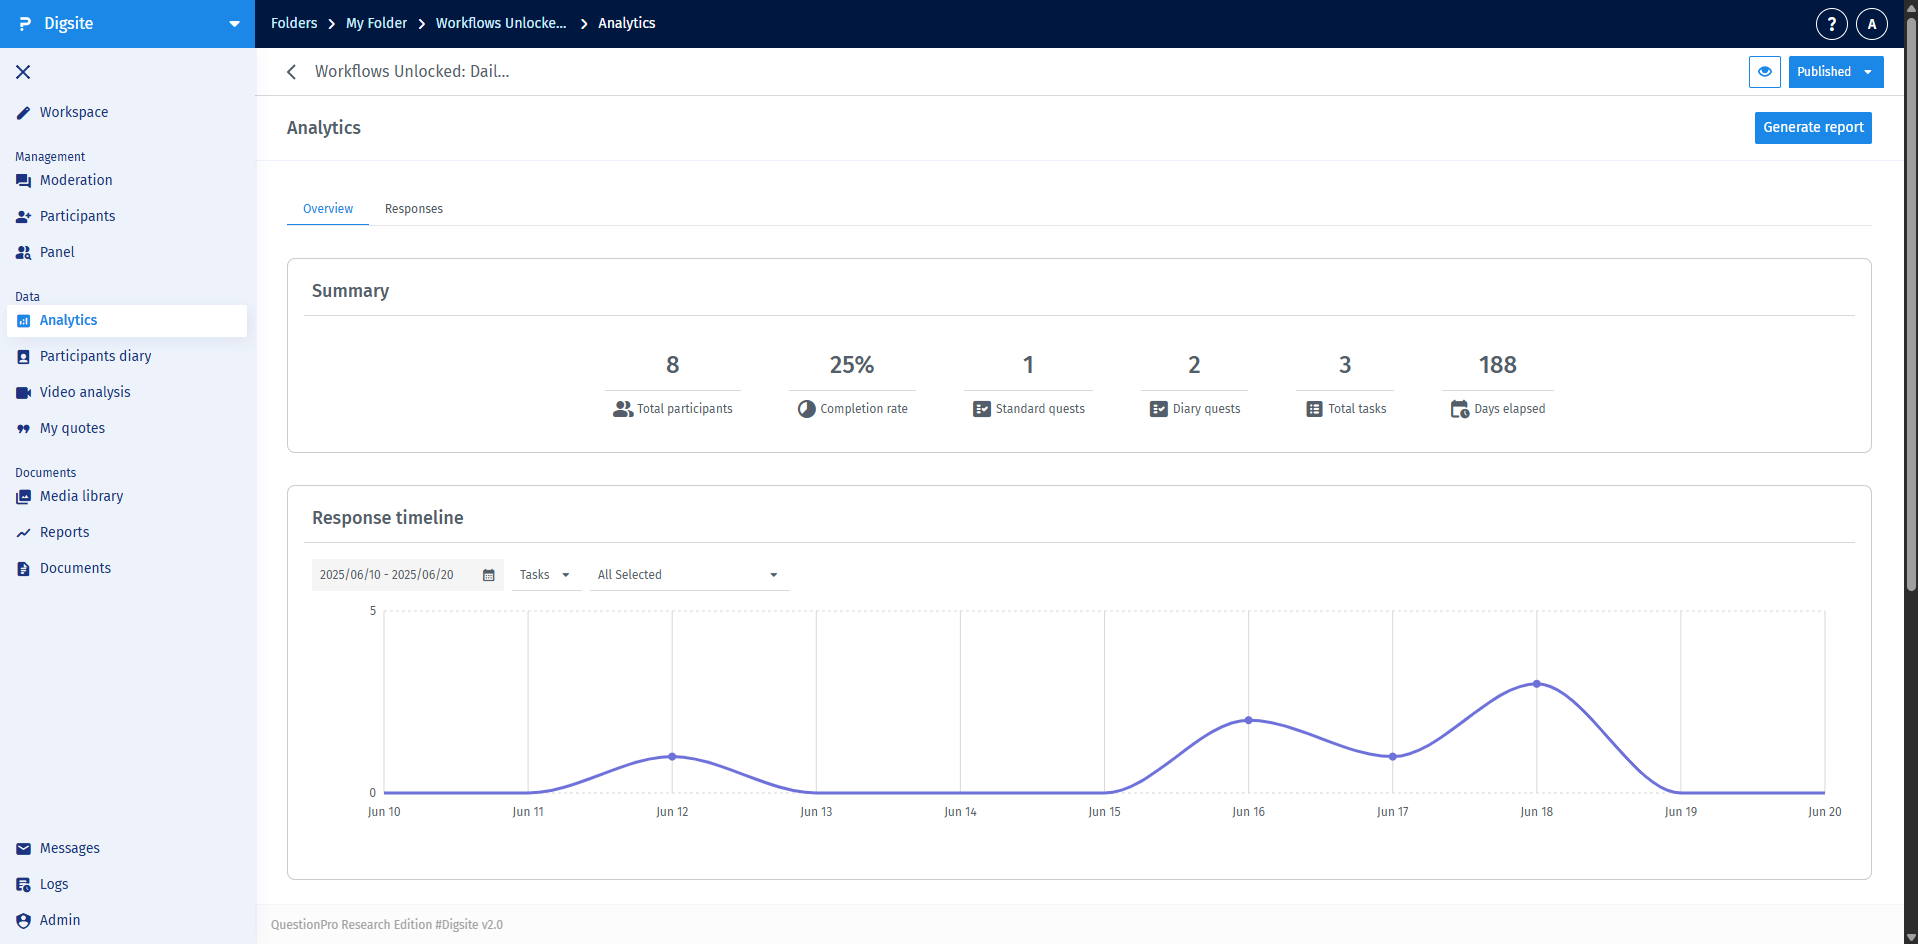
The Overview tab provides study-level insights with multiple cards:
- Summary Card: Displays key metrics including total participants, completion rate, standard quests, diary quests, total tasks, and days elapsed
- Response Timeline: Visual representation of when responses were submitted (daily, weekly, or monthly view)
- Completion Progress: Shows percentage of tasks and quests that are completed, in progress, or incomplete
- Thematic Analysis: AI-powered theme extraction with sentiment analysis applied across the study
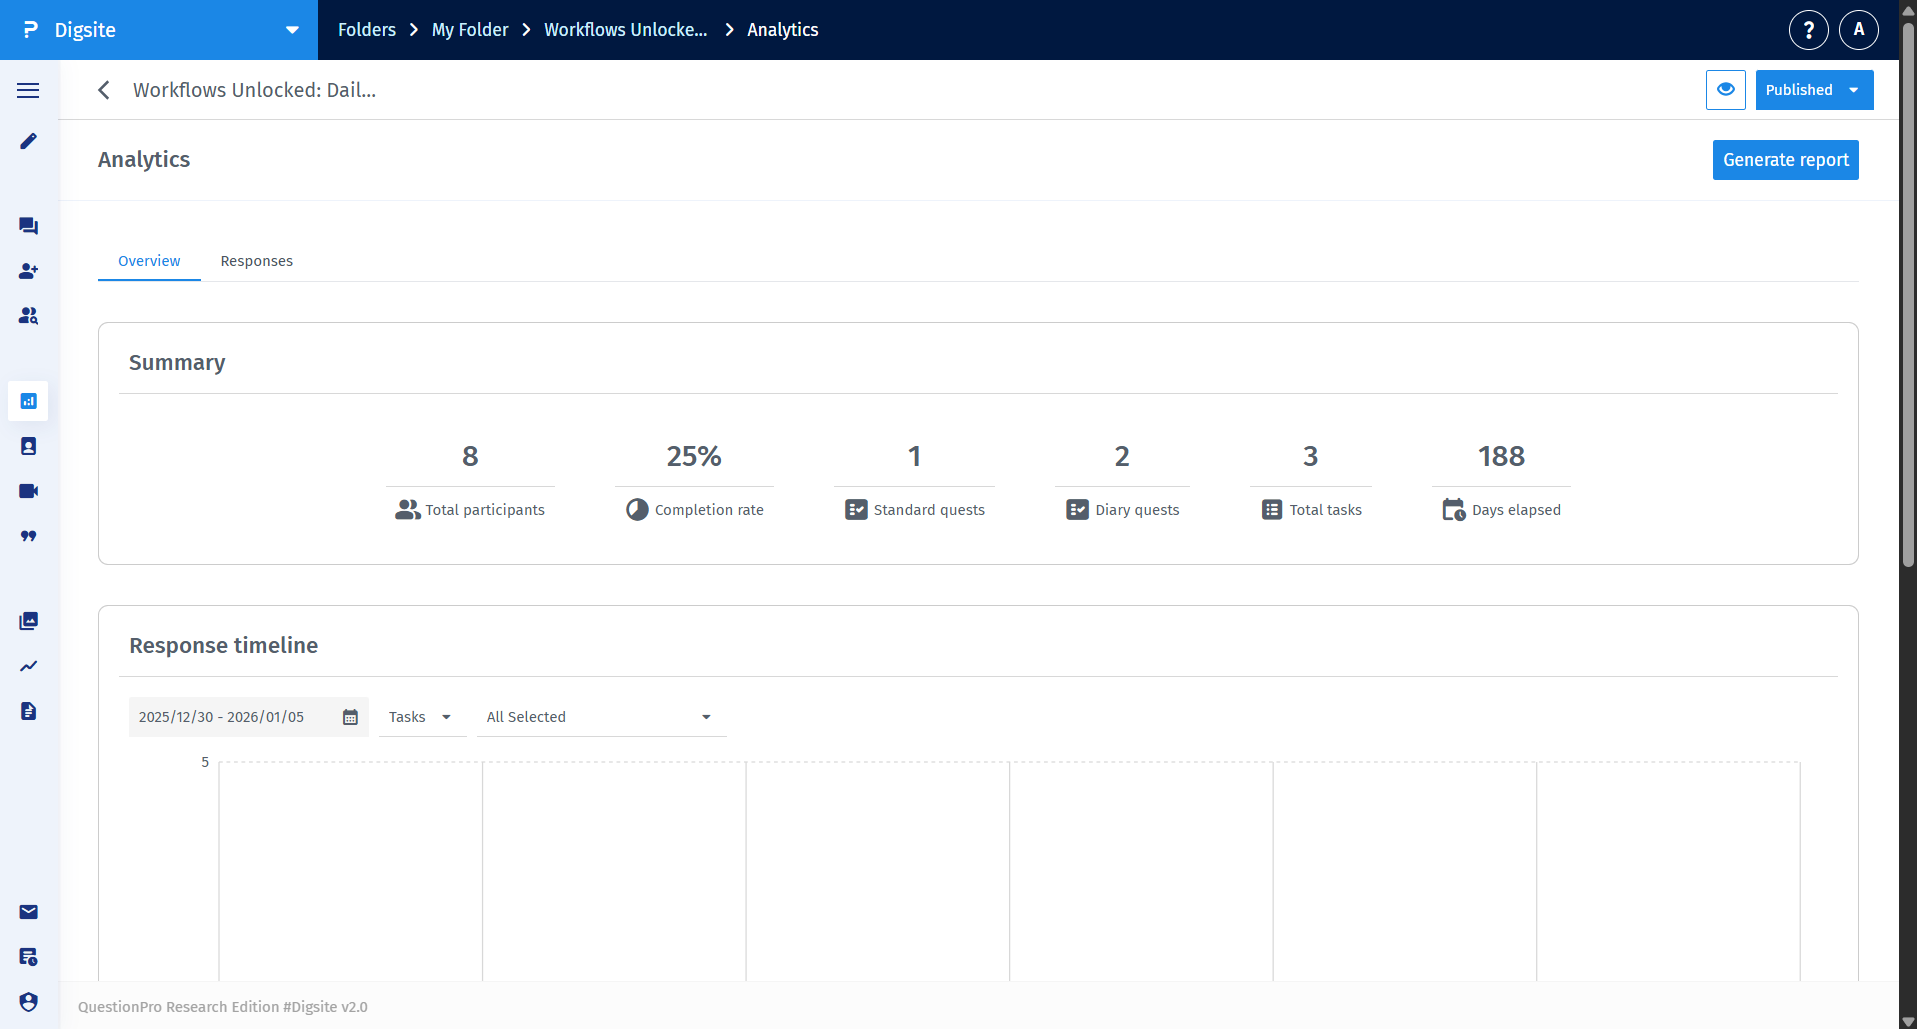
The Summary Card at the top of the Analytics Overview displays:
- Total number of participants in the study
- Overall completion rate (percentage)
- Count of standard quests
- Count of diary quests
- Total number of tasks
- Days elapsed since study start
This gives you an at-a-glance view of your study's progress and engagement.
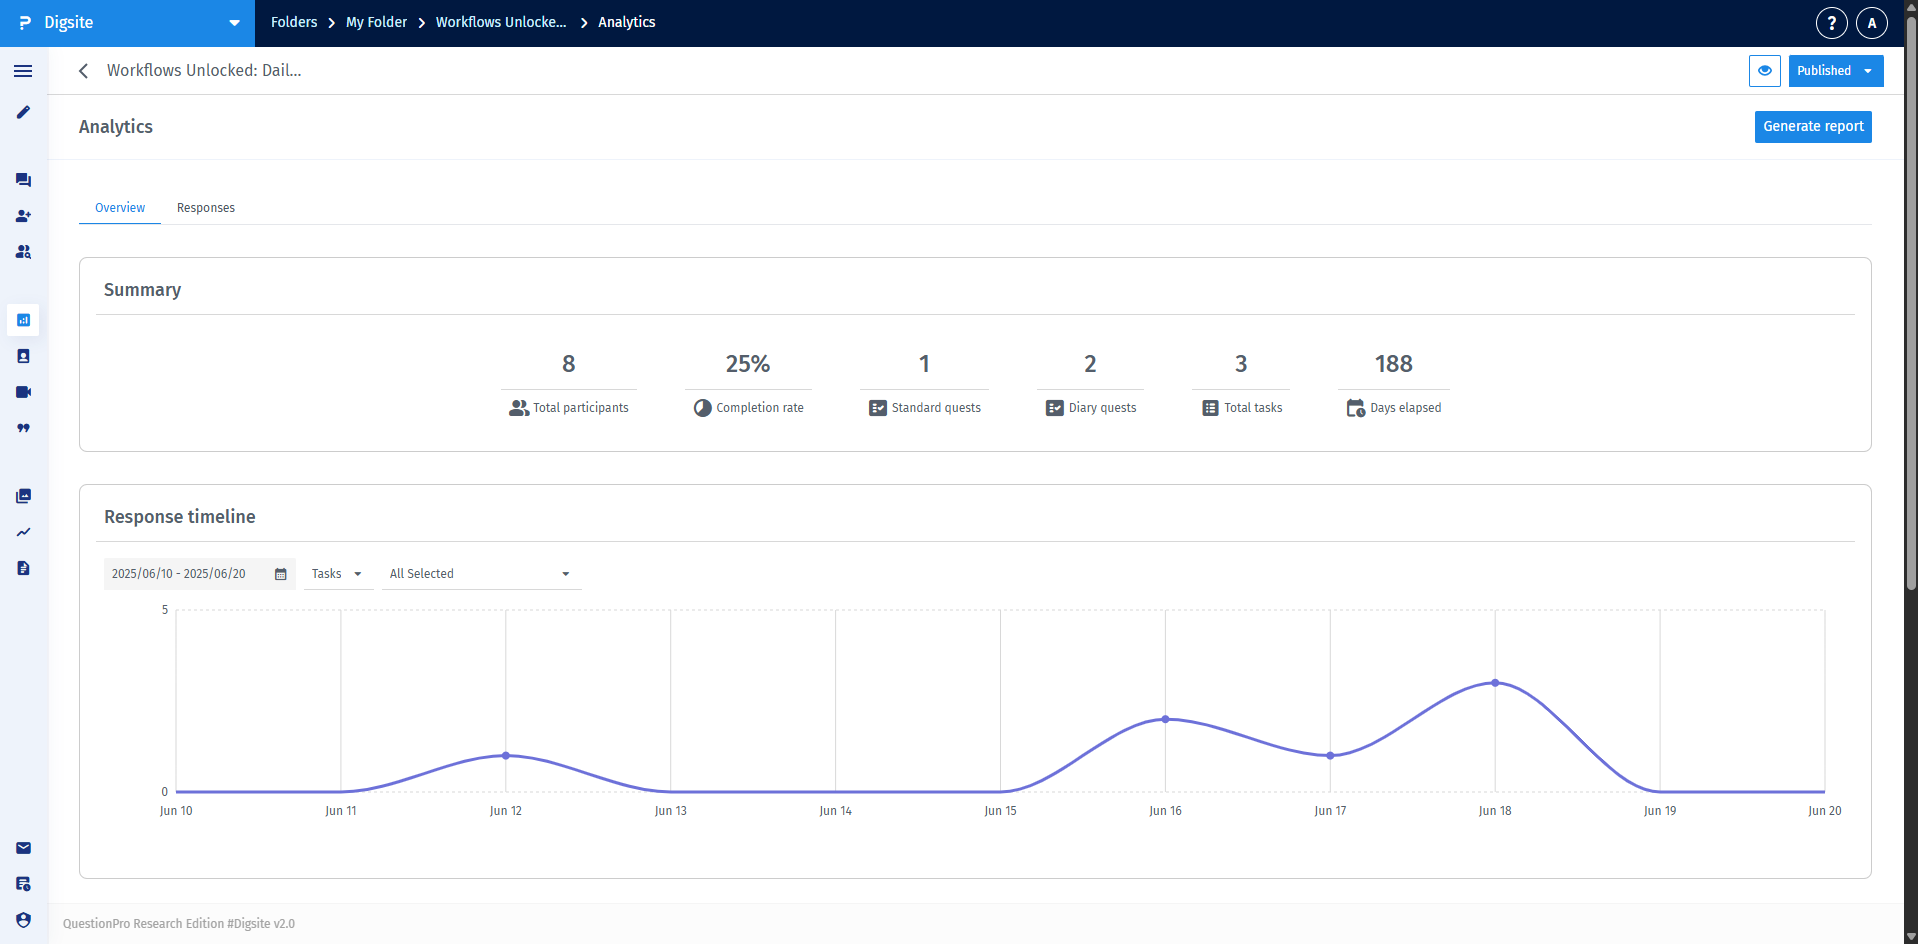
The Response Timeline provides a visual representation of participant activity over time. You can:
- See when responses were submitted throughout the study
- Switch between daily, weekly, and monthly views
- Filter by specific tasks or view all responses
- Identify patterns in participation and engagement
This helps you understand the temporal flow of your study and spot any drop-offs or surges in activity.
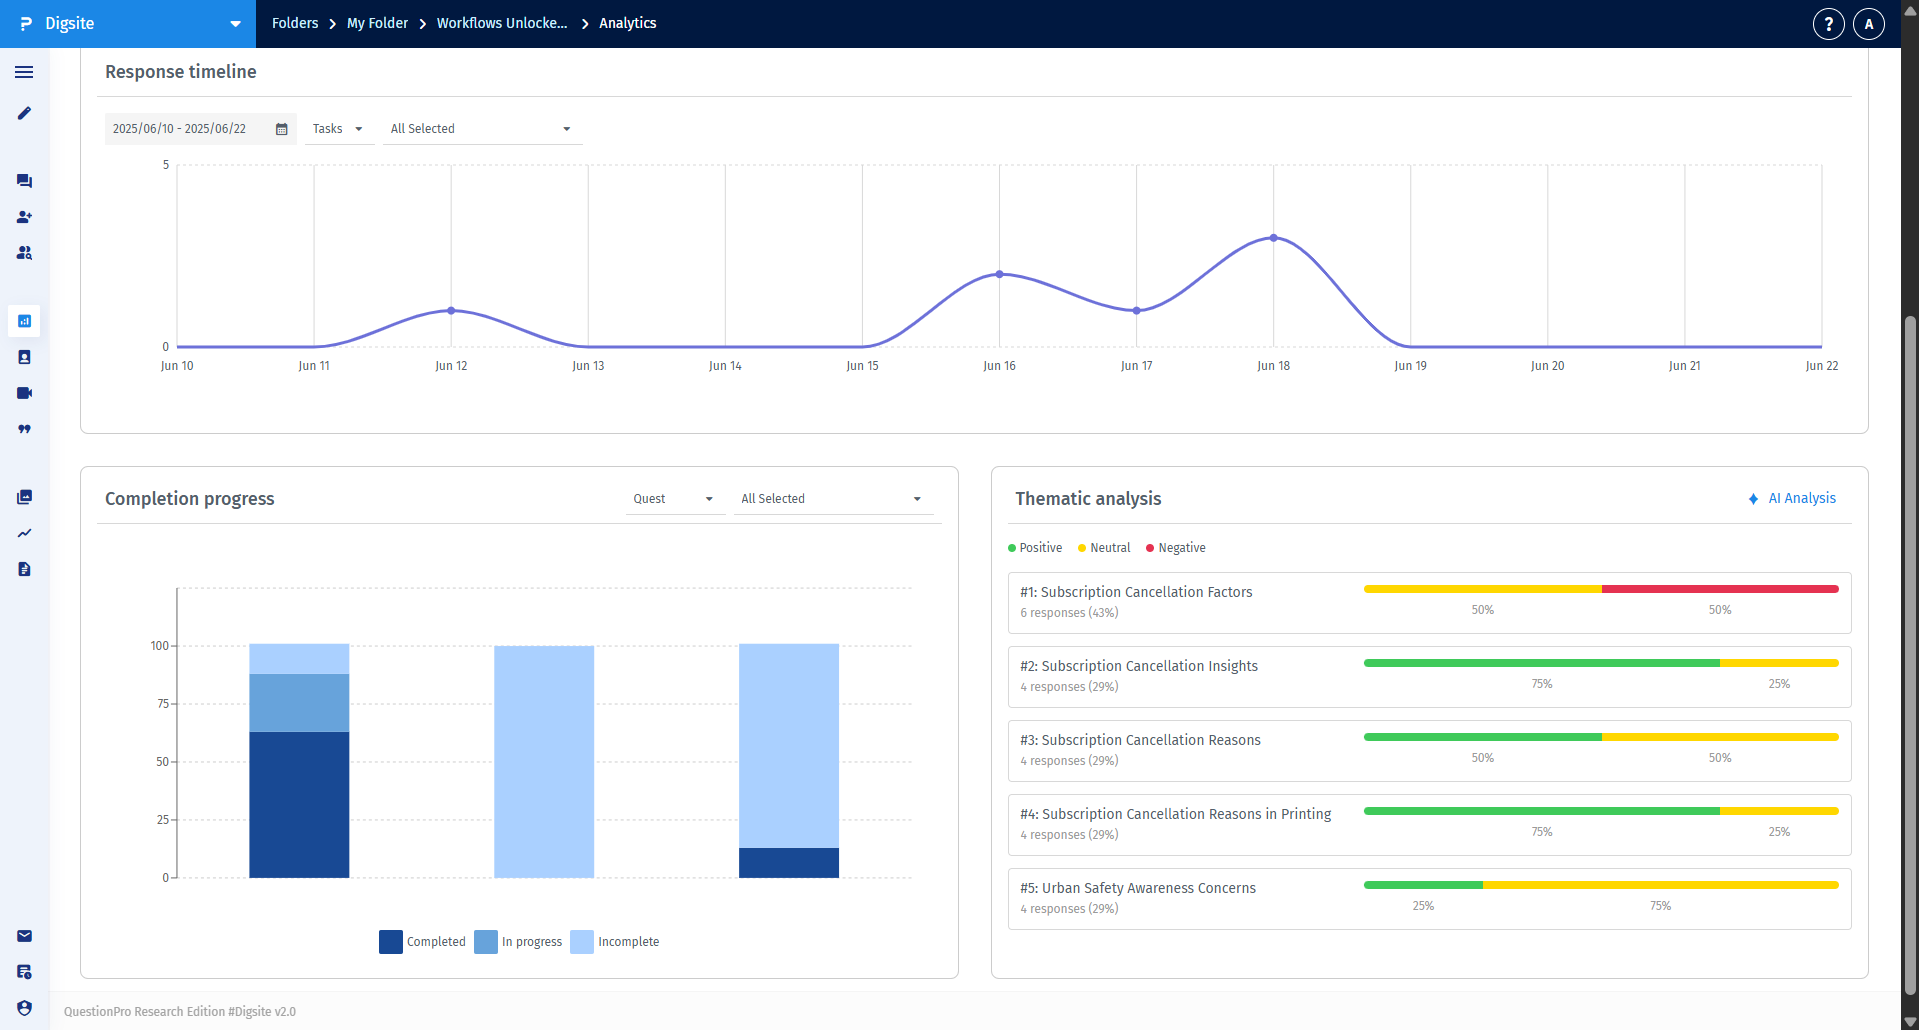
Completion Progress: This card visualizes the percentage of tasks and quests that are completed, in progress, and incomplete. You can filter by specific quests to see completion rates for different parts of your study.
Thematic Analysis: Using AI-powered natural language processing, this card extracts prominent themes from your study and displays them with sentiment indicators (positive, neutral, negative). Each theme shows:
- Theme title and description
- Number and percentage of responses
- Sentiment distribution across the theme
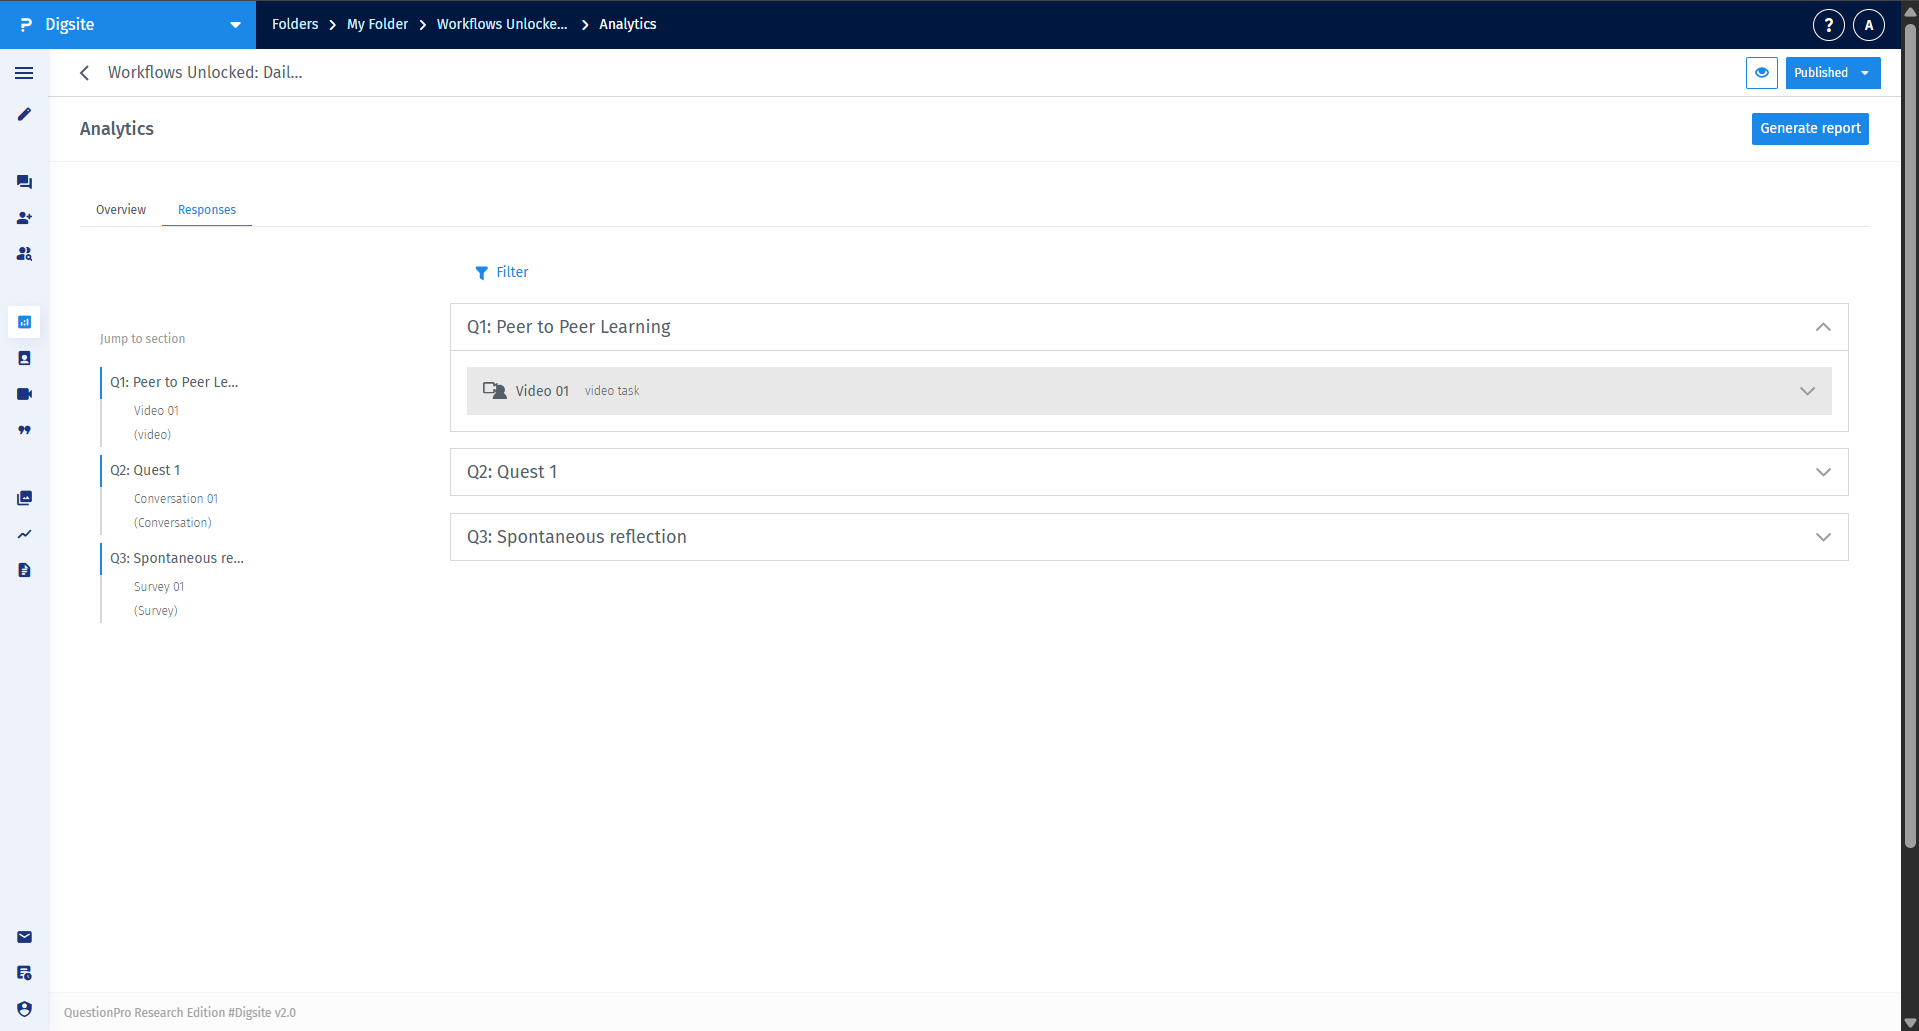
The Responses tab shows all participant responses organized by quests and tasks. You can:
- Navigate through quests using the left-hand sidebar
- View all tasks within each quest
- Apply filters to narrow down responses
- Expand quest sections to see detailed responses
This view is ideal for diving deep into specific parts of your study.
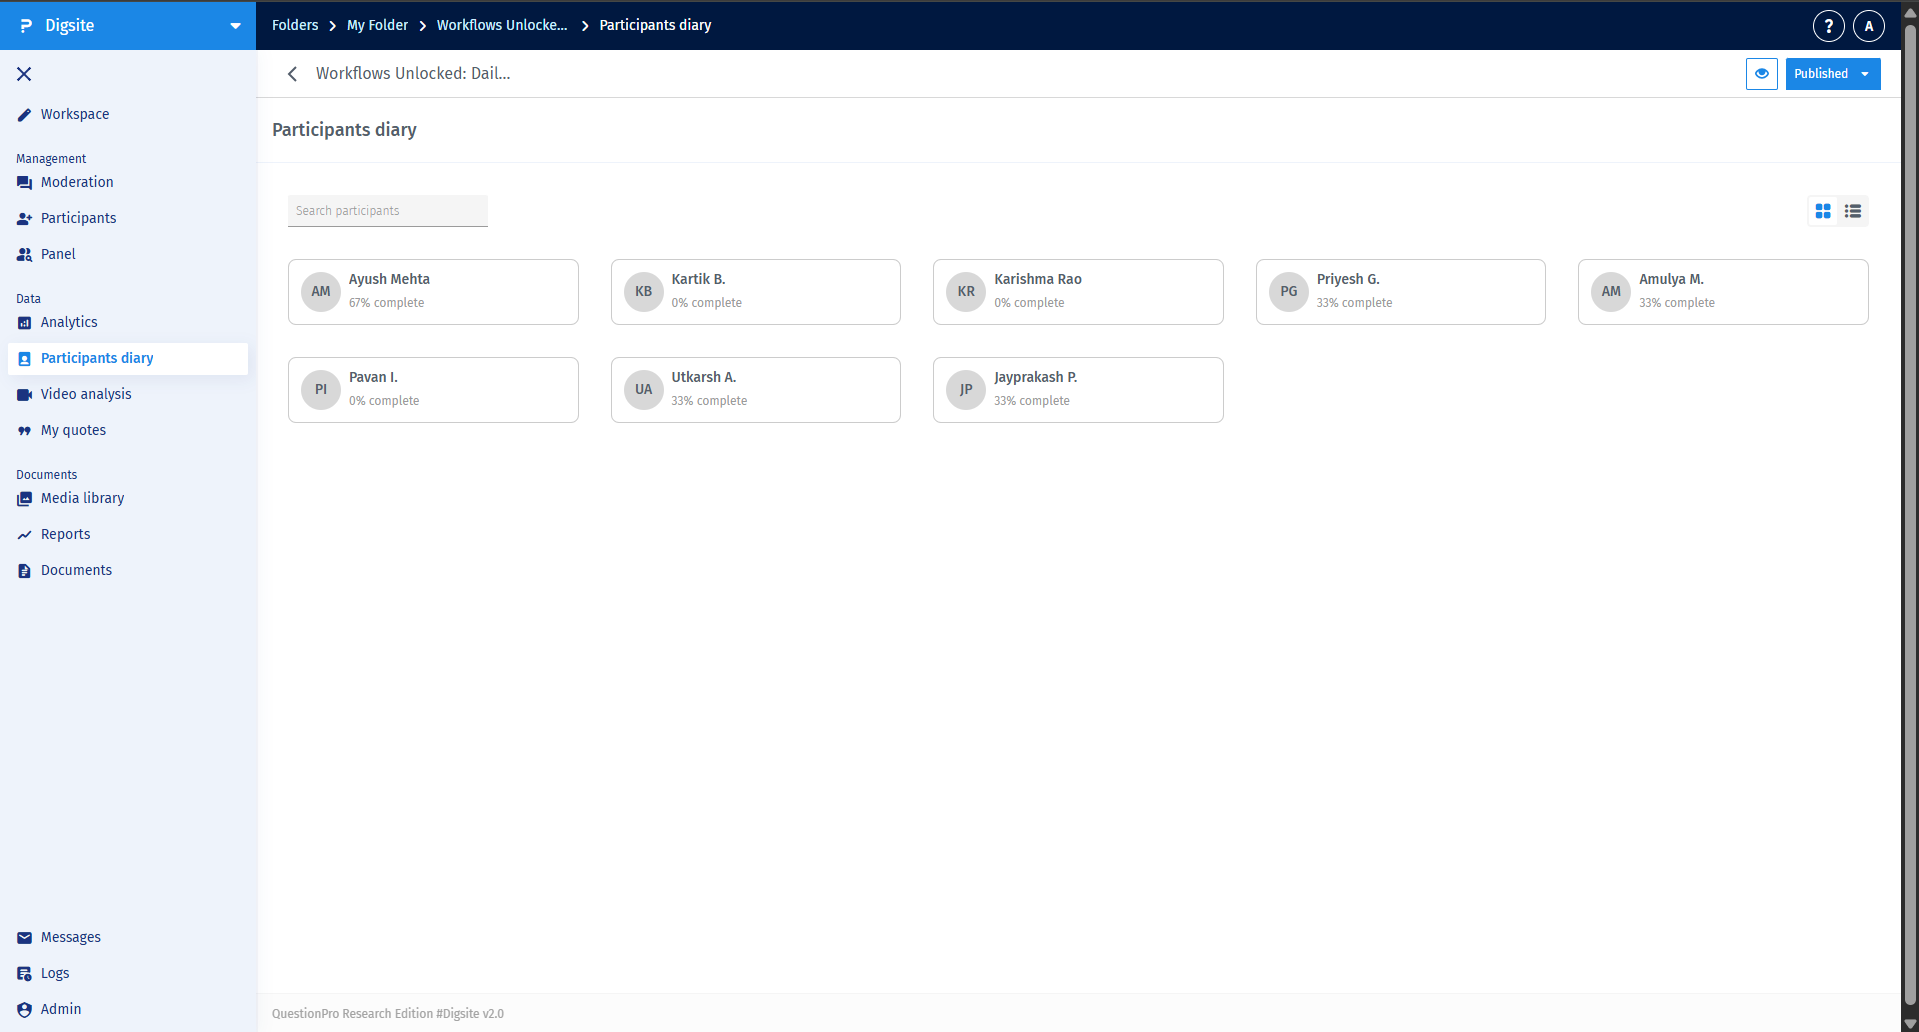
To view individual participant insights, navigate to the Participants diary section from the Analytics sidebar. This shows all participants in your study with their completion rates.
You can view participants in two formats:
- Card view: Visual cards showing participant profile initials with completion rate
- List view: Table format displaying names, email addresses, completion rate, start date, and last login date
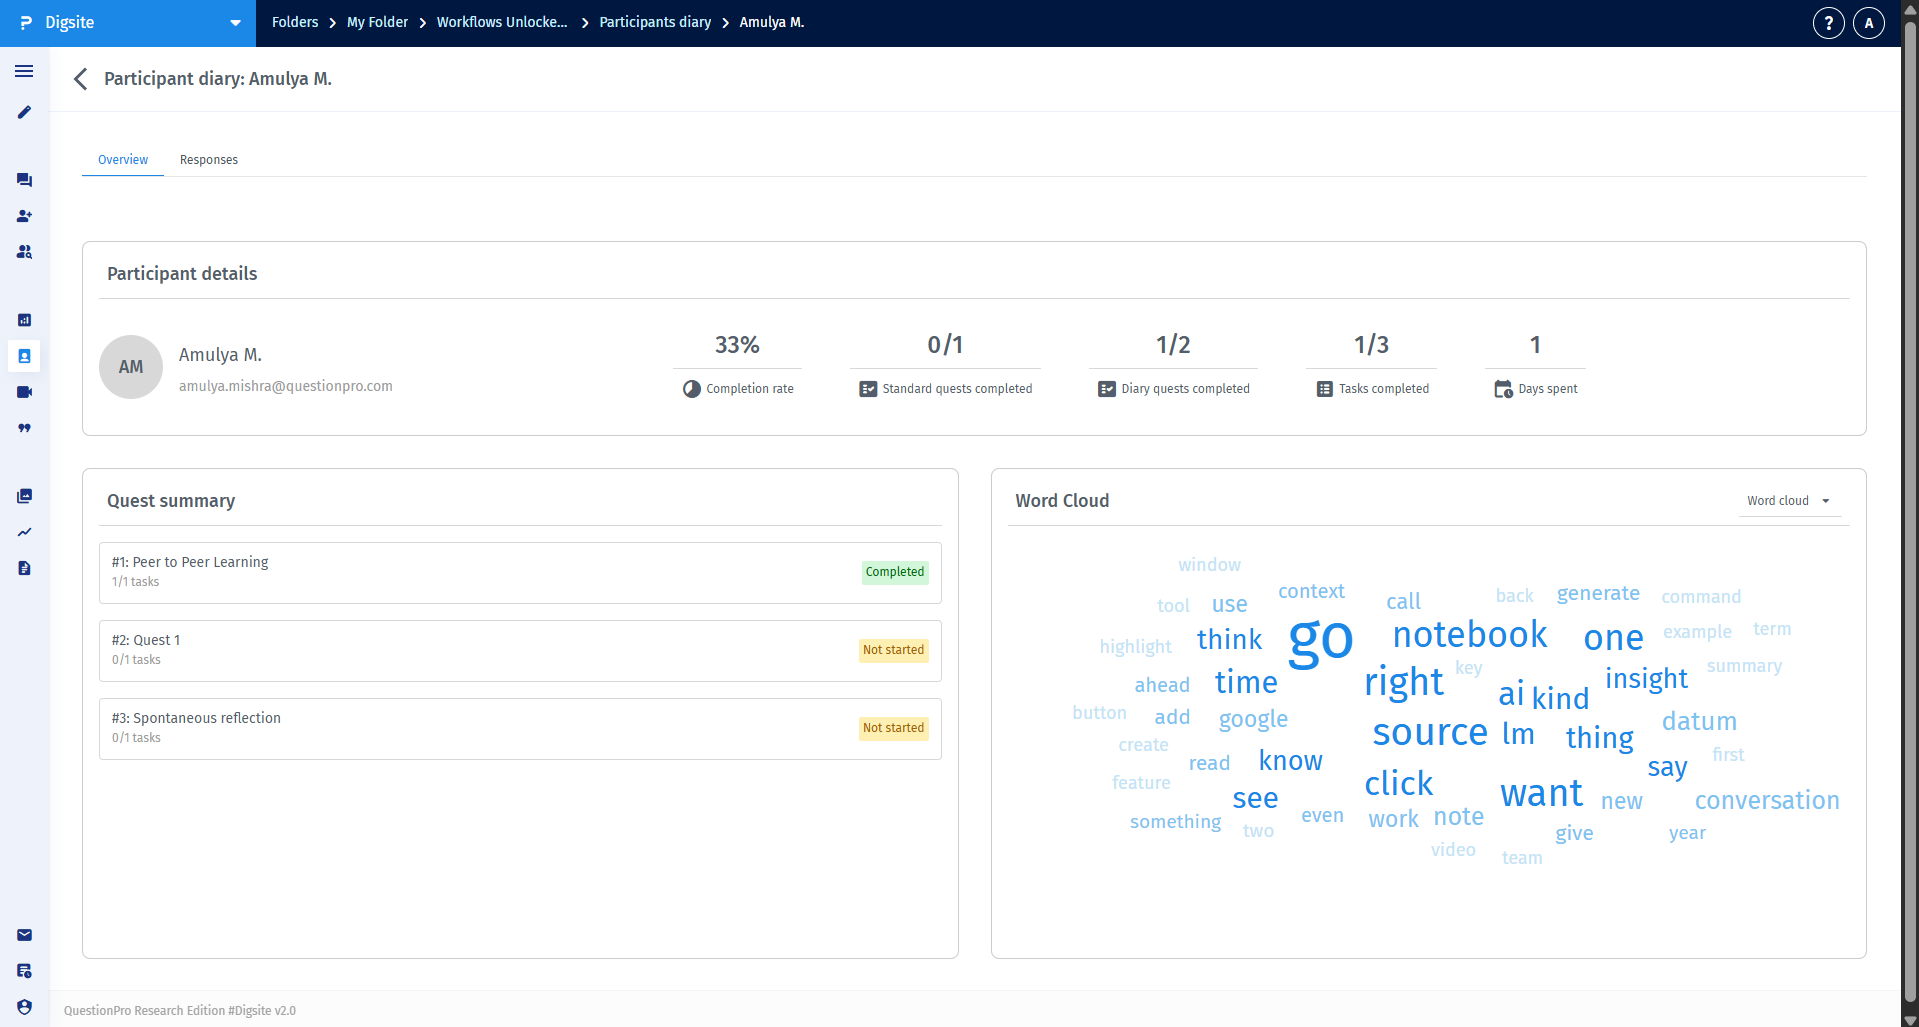
Click on any participant to see their complete profile, which includes:
- Participant Details: Profile picture, name, email, completion rate
- Quest Summary: Status of standard quests and diary quests, tasks completed, and time spent on the study
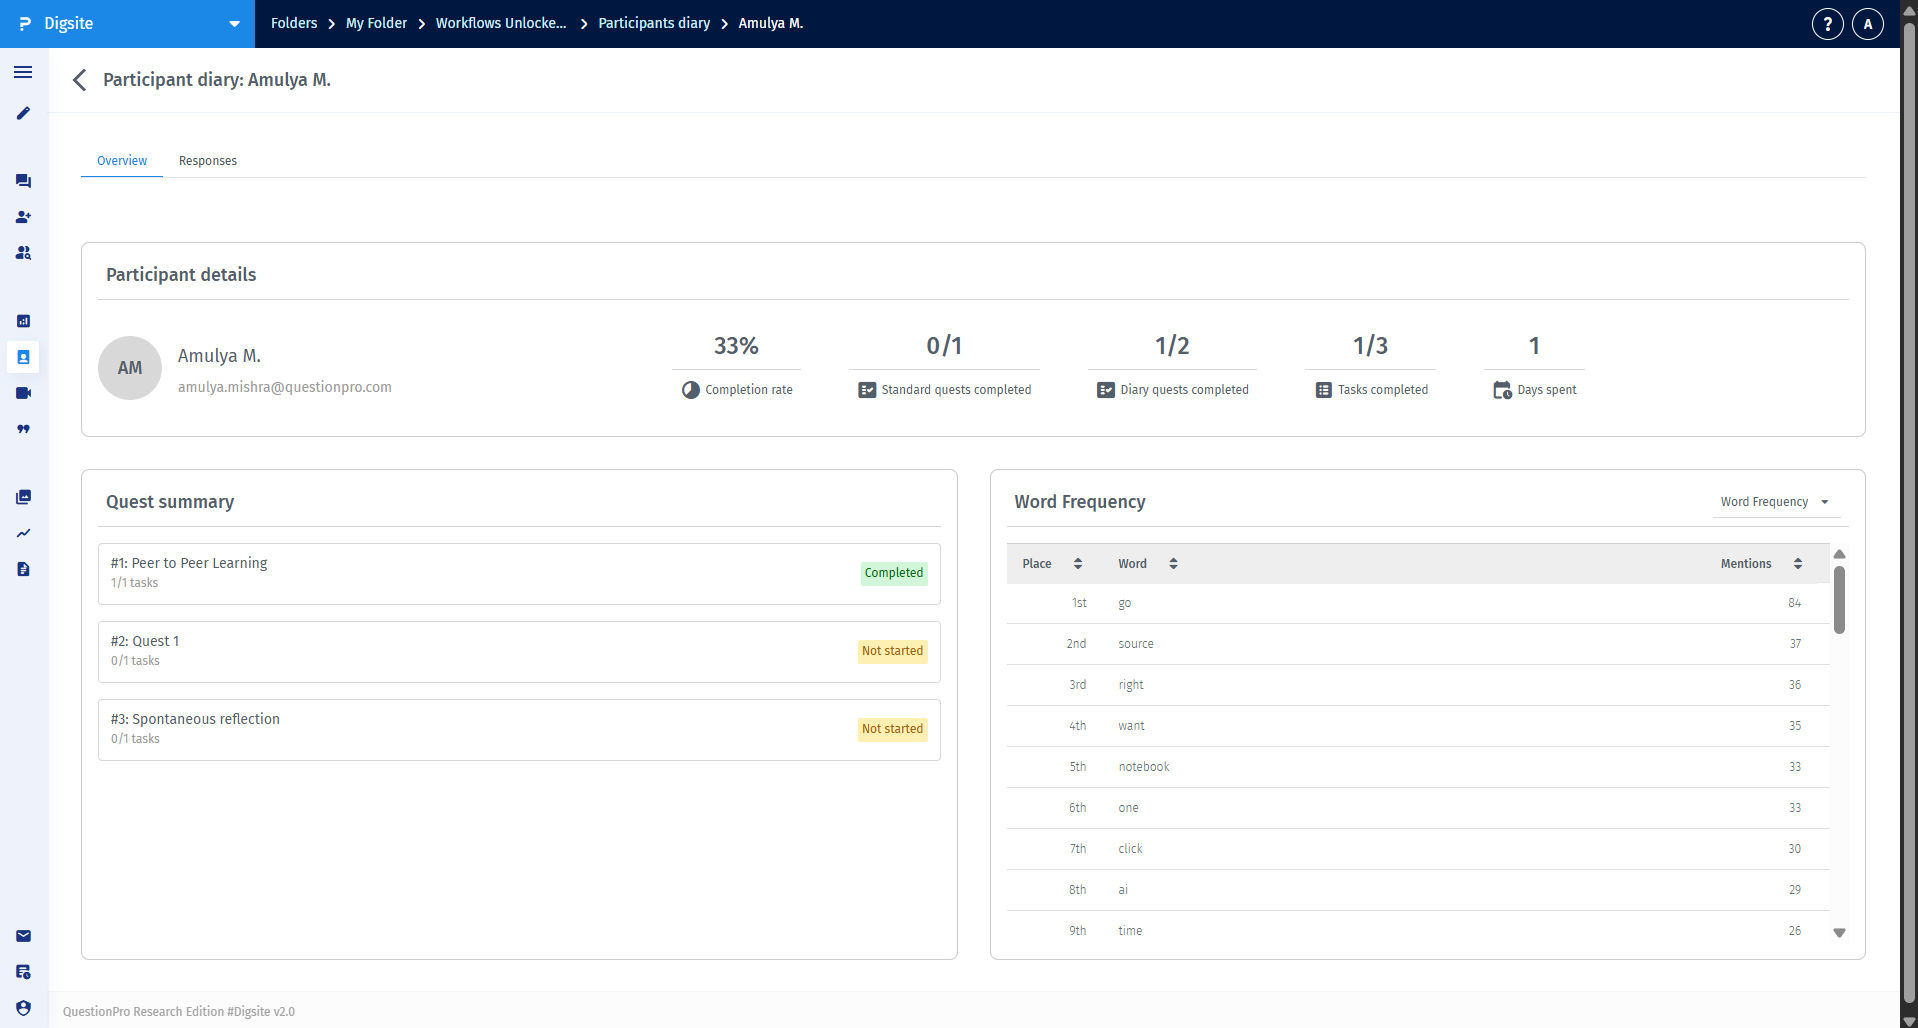
- Word Cloud: Visual representation of frequently used words in all their text responses
- Word Count: Toggle to view word frequency data instead of the word cloud
This provides a holistic view of each participant's journey through your study.
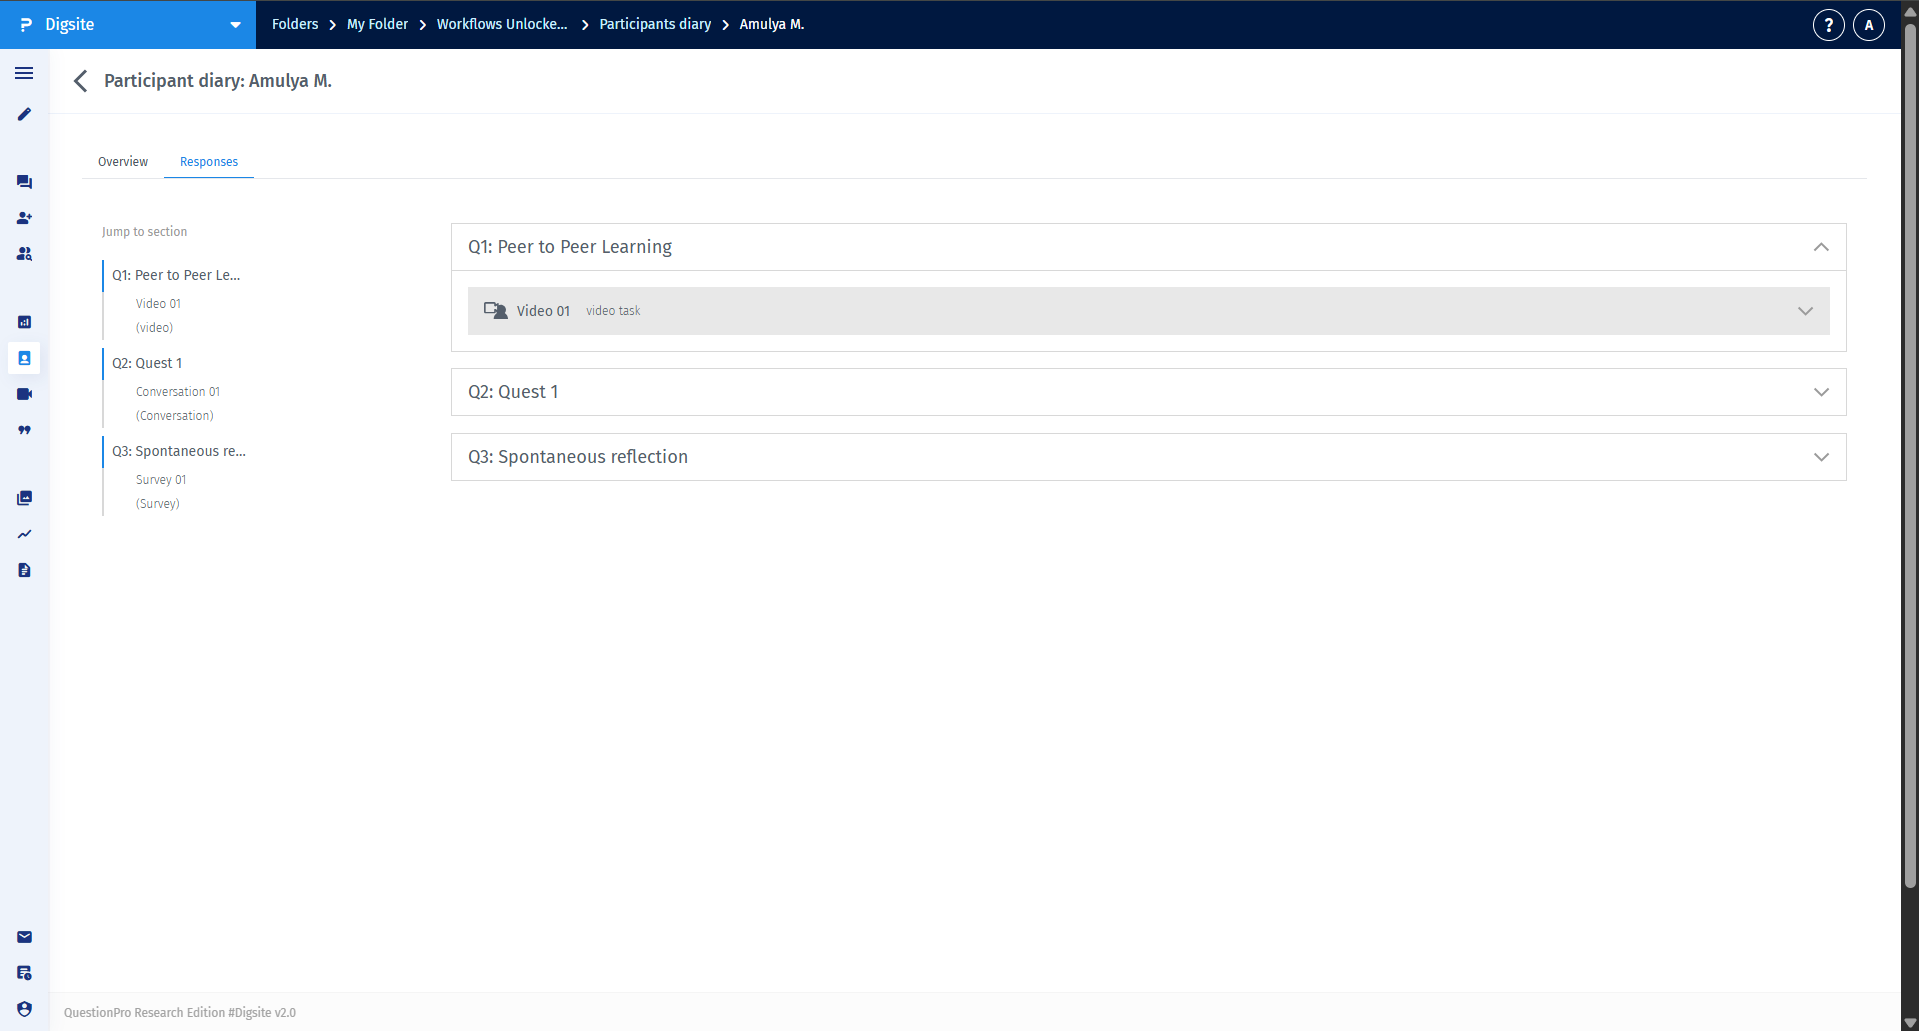
In the participant's profile, navigate to the Responses section to see all their submissions organized by quest and task. This view functions like a digital diary, showing:
- All quests the participant has engaged with
- Individual task responses within each quest
- Media uploads (videos, images) if included
- Response timestamps and context
This allows you to understand each participant's complete journey in context, just like reading a traditional diary.
Click the Generate report button in the top-right corner of the Analytics page to create downloadable reports from your study data. Before generating the report, you can apply filters to customize what's included:
- Select specific quests or tasks to include
- Filter by individual participants or participant segments
- Choose a date range for responses
- Specify which types of responses to include
Once generated, download your report to share with stakeholders, include in presentations, or analyze in external tools.