

- Media library
- Question limits
- Creating a survey from MS Word doc
- How to edit live surveys
- Survey blocks
- Survey block randomizer
- Question randomization
- Scale Library
- What is monadic testing?
- What is sequential monadic testing?
- Extraction Support for Image Chooser Question Types
- What is comparison testing?
- Custom validation messages
- Survey Builder with QuestionPro AI
- Testing Send
- Survey Preview Options
- Add Questions From a Document
- Survey Authoring 2025
- Standard question types
- Multiple choice question type
- Text question- comment box
- Matrix multi-point scales question type
- Rank order question
- Smiley-rating question
- Image question type
- Date and time question type
- reCAPTCHA question type
- Net Promoter Score question type
- Van Westendorp's price sensitivity question
- Choice modelling questions
- Side-By-Side matrix question
- Homunculus question type
- Predictive answer options
- Presentation text questions
- Multiple choice: select one
- Multiple choice: select many
- Page timer
- Contact information question
- Matrix multi-select question
- Matrix spreadsheet question
- Closed card sorting question
- Flex Matrix
- Text Slider Question Type
- Graphical Rating Scales
- Rank Order - Drag and Drop
- Bipolar Matrix - Slider
- Bipolar Matrix Likert Scale
- Gabor Granger
- Verified Digital Signature
- Star Rating Question Type
- Push to social
- Attach Upload File Question
- Constant Sum Question
- Video Insights
- Platform connect
- Communities Recruitment
- TubePulse
- Open Card Sorting
- Map Question Type
- VideoAI
- Answer type
- Reorder questions
- Question tips
- Text box next to question
- Text question settings
- Adding other option
- Matrix question settings
- Image rating question settings
- Scale options for numeric slider question
- Constant sum question settings
- Setting default answer option
- Exclusive option for multiple choice questions
- Validate question
- Bulk validation settings
- Remove validation message
- Question separators
- Question Code
- Page breaks in survey
- Survey introduction with acceptance checkbox
- RegEx Validation
- Question Library
- Embed Media
- Slider Start Position
- Answer Display - Alternate Flip
- Matrix - Auto Focus Mode
- Text validations
- Numeric Input Settings- Spreadsheet
- Answer Groups
- Hidden Questions
- Decimal Separator Currency Format
- Allow Multiple Files - Attache/Upload Question Type
- Text box - Keyboard input type
- Deep Dive
- Answer Display Order
- Alternate colors
- Conjoint Best Practices
- Multi-media file limits
- Conjoint Prohibited Pairs
- Add logo to survey
- Custom Themes
- Display Settings
- Auto-advance
- Progress bar
- Automatic question numbering option
- Enabling social network toolbar
- Browser Title
- Print or export to PDF, DOC
- Survey Navigation Buttons
- Accessible Theme
- Back and Exit Navigation Buttons
- Focus Mode
- Survey Layout
- Survey Layout - Visual
- Telly Integration
- Telly Integration
- Workspace URL
- Classic Layout
- Branching - Skip Logic
- Compound Branching
- Compound or delayed branching
- Response Based Quota Control
- Dynamic text or comment boxes
- Extraction logic
- Show or hide question logic
- Dynamic show or hide
- Scoring logic
- Net promoter scoring model
- Piping text
- Survey chaining
- Looping logic
- Branching to terminate survey
- Logic operators
- Selected N of M logic
- JavaScript Logic Syntax Reference
- Block Flow
- Block Looping
- Scoring Engine: Syntax Reference
- Always Extract and Never Extract Logic
- Matrix Extraction
- Locked Extraction
- Dynamic Custom Variable Update
- Advanced Randomization
- Custom Scripting Examples
- Survey Logic Builder - AI
- Custom Scripting - Custom Logic Engine Question
- Survey settings
- Save & continue
- Anti Ballot Box Stuffing (ABBS) - disable multiple responses
- Deactivate survey
- Admin confirmation email
- Action alerts
- Survey timeout
- Finish options
- Spotlight report
- Print survey response
- Search and replace
- Survey Timer
- Allowing multiple respondents from the same device
- Text Input Size Settings
- Admin Confirmation Emails
- Survey Close Date
- Respondent Location Data
- Review Mode
- Review, Edit and Print Responses
- Geo coding
- Dynamic Progress Bar
- Response Quota
- Age Verification
- Tools - Survey Options
- Live survey URL
- Customize survey URL
- Create email invitation
- Personalizing emails
- Email invitation settings
- Email list filter
- Survey reminders
- Export batch
- Email status
- Spam index
- Send surveys via SMS
- Phone & paper
- Adding responses manually
- SMS Pricing
- Embedding Question In Email
- Deleting Email Lists
- Multilingual Survey Distribution
- SMTP
- Reply-To Email Address
- Domain Authentication
- Email Delivery Troubleshooting
- QR Code
- Email Delivery and Deliverability
- Survey Dashboard - Report
- Overall participant statistics
- Dropout analysis
- Pivot table
- Turf analysis
- Trend analysis
- Correlation analysis
- Survey comparison
- Gap analysis
- Mean calculation
- Weighted mean
- Cluster Analysis
- Dashboard filter
- Download Options - Dashboard
- HotSpot analysis
- Heatmap analysis
- Weighted Rank Order
- Cross-Tabulation Grouping Answer Options
- A/B Testing in QuestionPro Surveys
- Data Quality
- Data Quality Terminates
- Matrix Heatmap Chart
- Column proportions test
- Response Identifier
- TURF Reach Analysis
- Bulk Edit System Variables
- Weighting and balancing
- Conjoint analysis designs
- Conjoint part worths calculation
- Conjoint calculations and methodology
- Conjoint attribute importance
- Conjoint profiles
- Market segmentation simulator
- Conjoint brand premium and price elasticity
- What is MaxDiff scaling
- MaxDiff settings
- Anchored MaxDiff Analysis [BETA Release]
- MaxDiff FAQ
- MaxDiff- Interpreting Results
- Automatic email report
- Data quality - Patterned responses
- Data quality - gibberish words
- Import external data
- Download center
- Consolidate report
- Delete survey data
- Data quality - All checkboxes selected
- Exporting data to Word or Powerpoint
- Scheduled reports
- Datapad
- Notification Group
- Unselected Checkbox Representation
- Merge Data 2.0
- Plagiarism Detection
- IP based location data
- SPSS Export
- SPSS variable name
- Update user details
- Update time zone
- Teams
- Add Users
- Usage dashboard
- Single user license
- License restrictions
- Troubleshooting login issues
- Software support package
- Welcome Email
- User Roles & Permissions
- Bulk Add Users
- Two-Factor Authentication
- Network Access
- Changing ownership of the survey
- Unable to access Chat support
- Navigating QuestionPro Products
- Agency Partnership Referral Program
- Response Limits

Voting Task Analytics – Digsite
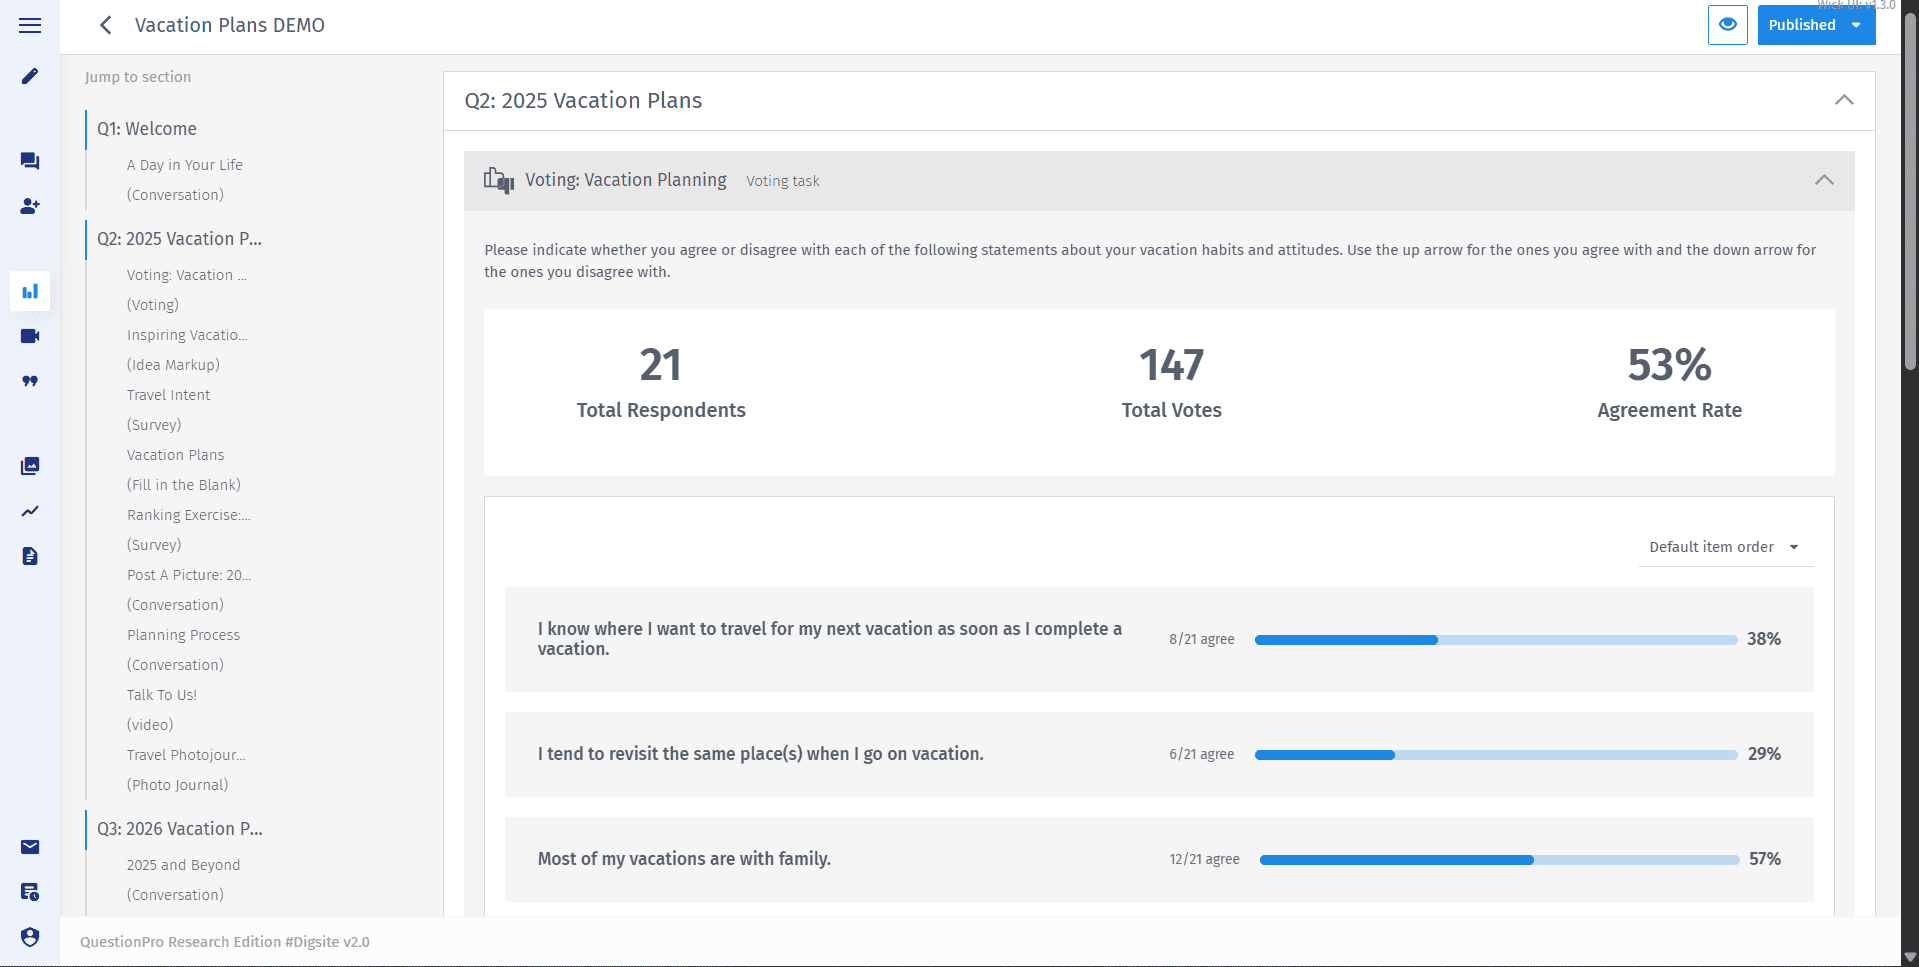
The voting task analytics view provides comprehensive insights into participant responses with proportional visualizations and key participation metrics. This interface displays voting patterns using neutral data presentation, allowing you to understand agreement levels and participation rates without bias.
View total respondents, overall agreement rates, and individual statement performance through clear visual indicators that show the proportion of support for each voting item in your study.
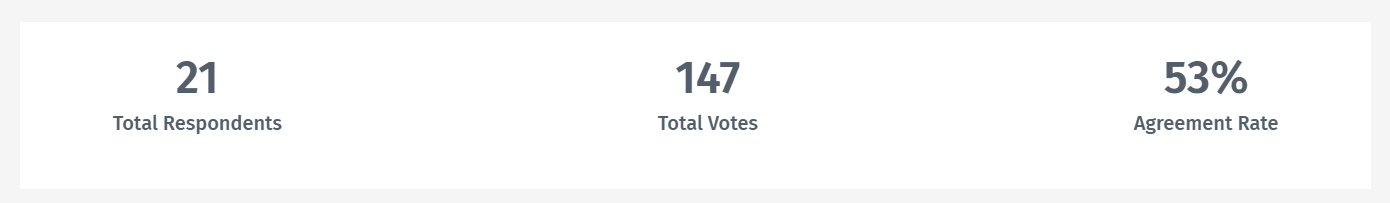
At the top of the analytics view, you'll find three key metrics that provide context for your voting results:
- Total Respondents - The number of participants who completed the voting task
- Total Votes - The aggregate number of individual votes cast across all statements
- Agreement Rate - The overall percentage showing how often participants agreed across all voting items
These summary statistics help you quickly assess participation levels and general consensus patterns before diving into individual statement analysis.
Each statement displays comprehensive voting data through multiple indicators:
- Vote count - Shows the number of participants who voted on this specific statement
- Visual proportion bar - Displays the ratio of agreement using a neutral blue color scheme
- Agreement percentage - The exact percentage of participants who agreed with the statement
The proportional visualization makes it easy to compare support levels across different statements and identify patterns in participant responses.
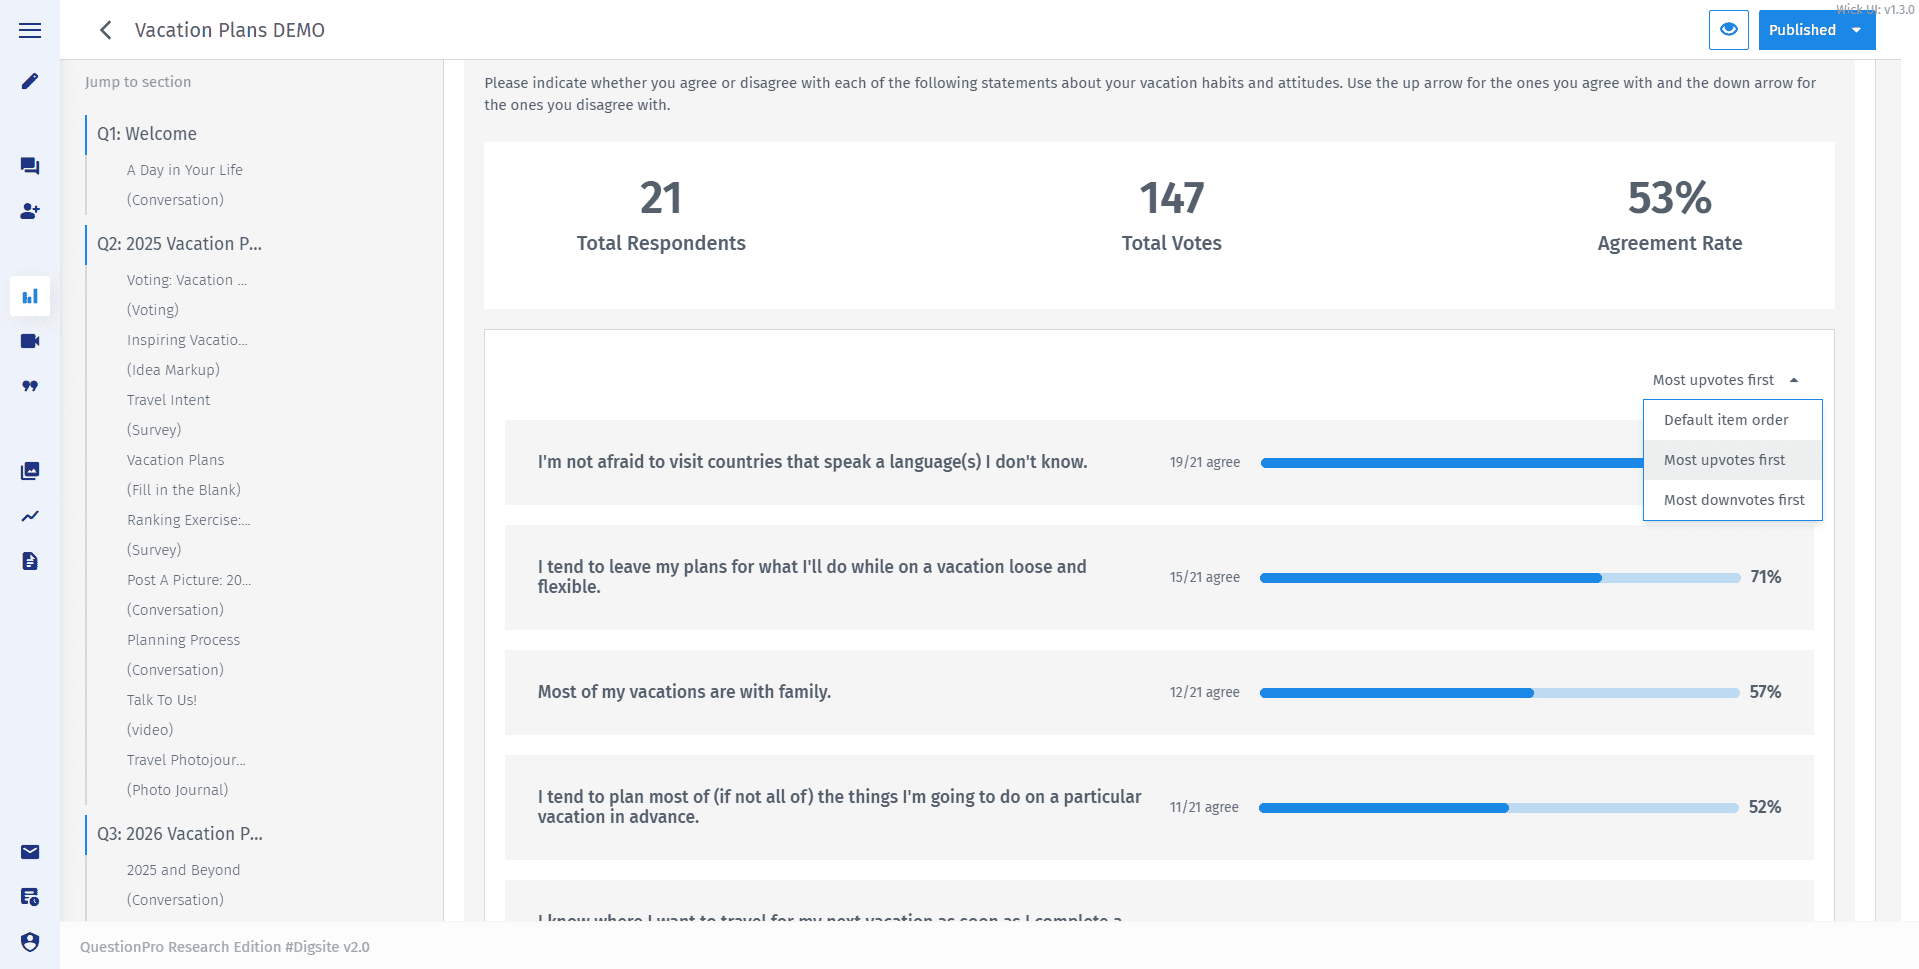
Use the sorting options in the top-right corner to organize your results based on different criteria:
- Most downvotes first - Shows statements with the lowest agreement rates at the top
- Default item order - Displays results in the original order they appeared in your voting task
- Most upvotes first - Prioritizes statements with the highest agreement rates
These sorting options help you quickly identify consensus items, controversial statements, or maintain the original context of your voting sequence.
The analytics interface uses a neutral blue color scheme for all voting visualizations, avoiding traditional green/red associations that might imply positive or negative sentiment. This approach ensures:
- Unbiased data presentation that doesn't suggest value judgments
- Consistent visual treatment across all statements regardless of agreement levels
- Professional appearance suitable for stakeholder presentations
The proportional bars show agreement levels as factual data points, allowing you to draw your own conclusions about what high or low agreement means in your research context.
Monitor participation effectiveness by examining:
- Response consistency - Compare individual vote counts to total respondents to identify incomplete responses
- Engagement patterns - Look for statements with significantly different participation levels
- Overall completion rate - Use the total votes versus expected votes (respondents × statements) to gauge task completion
Variations in individual statement participation can indicate comprehension issues, technical problems, or varying levels of participant engagement with specific content.
The neutral presentation and clear metrics make voting task results ideal for stakeholder communication:
- Reference specific agreement percentages for quantitative reporting
- Use the visual proportions to quickly communicate relative support levels
- Cite participation metrics to establish credibility and context
- Sort results to highlight key findings or maintain original task flow
The unbiased color scheme and professional layout support objective data presentation in research reports and presentations.